Person-Centered Therapy (Rogerian) therapists in Indiana, PA
Browse Person-Centered Therapy (Rogerian) therapists in Indiana, Pennsylvania. Compare credentials, specialties and therapeutic approach. Contact a therapist to learn more.

Person-Centered
Jennifer Barker
Licensed Professional Counselor, MA ATR-BC LPC
I practice therapy with a creative, person-centered, trauma-informed, strength based approach to meet clients where they are and to help them make changes to start the healing process.
12 Years Experience
In-Person Near Indiana, PA
Online in Indiana, PA
Person-Centered
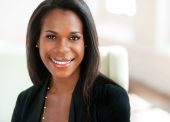
Dr. Christina Taylor
Licensed Professional Counselor, LPCMH, PhD
I am a licensed psychotherapist serving adult and teen clients alike in Delaware and surrounding the states of Pennsylvania and Maryland. My specialties center around adolescent and teen therapy, in addition to areas of focus including but not limited to anxiety, depression, and gender identity. With guidance, clients gain the ability and courage to take the steps needed to reach their goals.
As we experience difficult times in our lives, it is easy to feel alone and like others cannot understand. I seek to be a source of support during times of hardship, while also celebrating life's little joys and accomplishments with my clients. I look forward to walking with you through your journey.
13 Years Experience
Online in Indiana, PA

Person-Centered
Alaina Ables
Counselor/Therapist, LMHC
I operate from a Person-Centered Lens, which means the client is the expert in their own life; therefore, I collaborate with you to find the best possible approach. I provide a comfortable, non-judgmental space through a multicultural lens to ensure the ability of tackling each issue in a safe and healthy way.
5 Years Experience
Online in Indiana, PA (Online Only)
Person-Centered
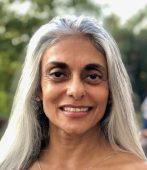
Dr. Jag Soni
Psychologist, Ph.D., HSPP, PCC, SPHR, SHRM-SCP
Finding the right therapist is about finding a space where you feel truly seen, understood, and empowered to change. My practice blends compassionate, relational support with a practical, goal-focused approach designed to help you move past feeling stuck and toward a life that feels authentic and manageable. We won’t just talk about the challenges you’re facing; we will work together to uncover root causes and foster the internal shifts necessary for lasting resilience and mental clarity. Whether you are navigating a difficult life transition or seeking a deeper sense of peace, I provide a safe, expert environment—available exclusively through secure telehealth—to honor your unique story and guide you toward a thriving future. If you’re ready to experience a measurable transformation in your well-being, I invite you to reach out to schedule your first appointment.
36 Years Experience
Online in Indiana, PA (Online Only)

Person-Centered
Dr. Marion Rudin Frank
Psychologist, Licensed Psychologist
As a licensed psychologist, a board certified clinical hypnotherapist and medical psychotherapist, I have been in private practice for 30 years in center city Philadelphia and Chestnut Hill. I am Jungian, feminist, and cognitive/behavioral in orientation, and use a blend of appropriate orientations.
41 Years Experience
Online in Indiana, PA
Person-Centered Therapy (Rogerian) therapists in Indiana, PA Statistics
Person-Centered Therapy (Rogerian) therapists in Indiana, PA average 17 years of experience and charge around $207 per session. 100% offer online sessions. The most commonly treated issues are Anxiety or Fears (85%), Depression (74%), and Stress (68%).
Average years in practice
17 Years Experience
Average cost per session
$207
Accept insurance
44%
Offer sliding scale
41%
Gender ID
| 69% |
Female |
|
| 26% |
Male |
|
| 4% |
Non-Binary |
|
| 1% |
Gender Fluid |
|
Session Type
| 59% |
In Person and Online |
|
| 41% |
Online Only |
|
Top Specialties
| 85% | Anxiety or Fears |
| 74% | Depression |
| 68% | Stress |
| 57% | Self Esteem |
| 56% | Loss or Grief |
| 52% | Trauma and PTSD |
| 48% | Social Anxiety |
Ages Served
| 99% | Adult |
| 80% | Young Adult |
| 48% | Senior |
| 45% | Teen |
| 22% | Children |
Client Focus
| 59% | Women |
| 40% | LGBTQ+ |
| 37% | Men |
| 23% | Black / African American |
| 23% | Hispanic / Latino |