Persons with Disabilities therapists in Saint Andrews, SC
Browse Persons with Disabilities therapists in Saint Andrews, South Carolina. Compare credentials, specialties and therapeutic approach. Contact a therapist to learn more.
Serving Persons with Disabilities
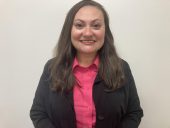
Danielle Coons Counseling
Licensed Professional Counselor, MA, LPC/SC, NCC
Neuro-affirming Individual Therapy & Family Therapy to clients of all ages including children (7+), adolescents & adults struggling with ADHD, Autism, AuDHD, Dyslexia, Anxiety & Depression. As a Neurodivergent therapist with both clinical and lived experience as a diagnosed AuDHD myself, I am able to offer unconditional positive regard and listen without judgement.
4 Years Experience
Online in Saint Andrews, SC (Online Only)
Serving Persons with Disabilities
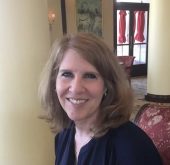
Advent Christian Counseling
Marriage and Family Therapist, LMFT (R.N.-retired)
What distinguishes my practice is the breadth of perspective I bring — decades in the healing professions, first as a Registered Nurse and subsequently as a counselor — affording me a genuinely holistic understanding of the individuals I serve. My Christian faith and regard for Biblical truth provide the foundation for all that I do, yet I welcome clients of any background who desire growth grounded in traditional values. If you have found that surface-level approaches fall short of what you need, and you seek someone who will thoughtfully and faithfully accompany you through life's more difficult terrain, I would be honored to speak with you.
10 Years Experience
Online in Saint Andrews, SC (Online Only)
Serving Persons with Disabilities
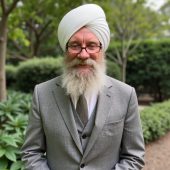
Karambir Khalsa | Khalsa Psychology PLLC
Psychologist, (AZ PSY-005603), Non-Licensed Clinician (CO NLC.0107000)
I create a safe place for you to process your concerns and heal. Sessions are conversational in nature. I want to hear your concerns in your own words and I will reflect back what I am hearing so you can confirm or correct. Our conversations help me to know which techniques are relevant and applicable to your concerns.
3 Years Experience
Online in Saint Andrews, SC

Serving Persons with Disabilities
Dr. Samira Paul Olive Tree Psychology Clinic LLC
Psychologist, PsyD
At Olive Tree Psychology Clinic LLC, we believe that healing requires entering a space where you feel truly seen, understood, and respected. We honor your presence and we meet you exactly where you are.
7 Years Experience
Online in Saint Andrews, SC (Online Only)
Serving Persons with Disabilities
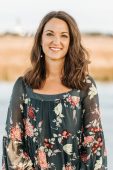
Leigh Ann Lichty | INNER FLOW Counseling & Art Therapy, LLC
Licensed Professional Counselor, MA, LPC, ATR-BC
I enjoy helping people navigate a variety of life stressors, grief, and trauma, through evidenced-based treatment, as well as a little creativity and creative thinking! I am a Licensed Professional Counselor and Board Certified Art Therapist practicing in Mount Pleasant, SC. I offer telehealth to residents of SC. EMDR and IFS are my primary modes of therapy, and I also enjoy incorporating ACT, CBT, guided imagery, somatic exercises, and breath work! Art therapy is an option in treatment that can bring another layer of exploration and intuition to your sessions. Thank you for considering me for your counseling needs! Please reach out with any questions about my services.
11 Years Experience
Online in Saint Andrews, SC
Persons with Disabilities therapists in Saint Andrews, SC Statistics
Persons with Disabilities therapists in Saint Andrews, SC average 16 years of experience and charge around $221 per session. 100% offer online sessions. The most commonly treated issues are Anxiety or Fears (82%), Depression (74%), and Loss or Grief (65%).
Average years in practice
16 Years Experience
Average cost per session
$221
Accept insurance
41%
Offer sliding scale
42%
Gender ID
| 59% |
Female |
|
| 32% |
Male |
|
| 5% |
Non-Binary |
|
| 4% |
Gender Fluid |
|
Session Type
| 51% |
Online Only |
|
| 49% |
In Person and Online |
|
Top Specialties
| 82% | Anxiety or Fears |
| 74% | Depression |
| 65% | Loss or Grief |
| 60% | Stress |
| 59% | ADHD |
| 56% | Trauma and PTSD |
| 55% | Self Esteem |
Ages Served
| 99% | Adult |
| 82% | Young Adult |
| 65% | Senior |
| 49% | Teen |
| 28% | Children |
Client Focus
| 100% | Persons with Disabilities |
| 90% | Women |
| 69% | LGBTQ+ |
| 67% | Men |
| 59% | Black / African American |