LGBTQ+ Issues therapists in Bartlett, TN
Browse LGBTQ+ Issues therapists in Bartlett, Tennessee. Compare credentials, specialties and therapeutic approach. Contact a therapist to learn more.
View nearby cities

LGBTQ+
Chasity Goddard
Marriage and Family Therapist, AMFT
I am LGBTQ+ affirming and accepting. If you are struggling, you do not have to justify anything to me or worry about any judgements. I want to know you as the individual you are and help you achieve the goals you have for yourself.
1 Years Experience
Online in Bartlett, TN (Online Only)

LGBTQ+
Tara Murphy
Psychologist, Psy.D.
I provide an affirming, anti-oppressive space for LGBTQ+ clients and families. Using IFS, narrative therapy, and relational approaches, I help clients process shame, trauma, or identity-related stressors and build resilience. Mindfulness, somatic and integrative tools support coping with discrimination or isolation. I have additional experience collaborating with medical professionals to provide assessments need for gender affirming care.
29 Years Experience
Online in Bartlett, TN (Online Only)

LGBTQ+
Beth Janis
Psychologist, Ph.D.
Everyone deserves to feel seen, understood, and - most importantly - safe, and especially so in this current sociopolitical climate. I prioritize making my sessions safe and inclusive for all members of the LGBT+ community, and I'm here to partner with you as you navigate the current stressors you may be facing. Whether you're wanting to increase self-understanding, explore relationship patterns, or navigate other areas of your life, you deserve to be able to hold all aspects of your identity with compassion and care.
8 Years Experience
Online in Bartlett, TN

LGBTQ+
Julien Moe
Hypnotherapist, Diploma in Clinical and Applied Hypnosis, Diploma in Life Coaching
To be gay or lesbian is inborn and you should be proud of yourself. "I am here to help you build a bold & real you!"
"Out of the Closets and into the Streets"
"We are here & We are Queer."
I will help you transform yourself into a King or Queen or both.
"Gay by birth, fabulous by choice"
"My life, my rules"
"Let me help you build a real you with a touch of care"
LGBTQ+ identities are not disorders and do not require a "cure" or treatment, but hypnotherapy can support mental health, self-acceptance, and stress management. It is often used for anxiety, depression, and confidence building, especially regarding coming out or navigating discrimination.
10 Years Experience
Online in Bartlett, TN
LGBTQ+
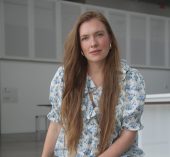
Emily Hurlin
Licensed Clinical Social Worker, LISW, LCSW
I was raised in an LGBTQ+ household, and I bring that lived understanding into my work. LGBTQ+ individuals and couples are welcome here without needing to explain or defend who they are. I support clients navigating coming out, family acceptance, minority stress, and the particular dynamics of queer and non-traditional relationships, while also working on the same connection and conflict concerns every couple faces.
8 Years Experience
Online in Bartlett, TN (Online Only)
LGBTQ+ Issues therapists in Bartlett, TN Statistics
LGBTQ+ Issues therapists in Bartlett, TN average 15 years of experience and charge around $206 per session. 100% offer online sessions. The top treatment approaches are Cognitive Behavioral Therapy (CBT) (69%), Acceptance & Commitment Therapy (ACT) (42%), and Psychodynamic Therapy (41%).
Average years in practice
15 Years Experience
Average cost per session
$206
Accept insurance
31%
Offer sliding scale
32%
Gender ID
| 60% |
Female |
|
| 32% |
Male |
|
| 5% |
Non-Binary |
|
| 3% |
Gender Fluid |
|
Session Type
| 53% |
In Person and Online |
|
| 47% |
Online Only |
|
Top Treatment Approaches
| 69% | Cognitive Behavioral Therapy (CBT) |
| 42% | Acceptance & Commitment Therapy (ACT) |
| 41% | Psychodynamic Therapy |
| 37% | Person-Centered Therapy (Rogerian) |
| 36% | Existential / Humanistic Therapy |
| 35% | Emotionally Focused Therapy (EFT) |
| 35% | Multicultural Therapy |
Ages Served
| 99% | Adult |
| 77% | Young Adult |
| 52% | Senior |
| 39% | Teen |
| 18% | Children |
Client Focus
| 82% | LGBTQ+ |
| 62% | Women |
| 50% | Men |
| 34% | Black / African American |
| 31% | Hispanic / Latino |