Native American therapists in Cibolo, TX
Browse Native American therapists in Cibolo, Texas. Compare credentials, specialties and therapeutic approach. Contact a therapist to learn more.

Serving Native American
Dr. Jillian Mahatha
Licensed Mental Health Counselor, Ph.D., LCMHC, NCC, ACS, CCTP
Supporting others is more than my profession—it's a calling. I am dedicated to providing a safe, supportive, and nonjudgmental space where you feel heard, understood, and empowered. Together, we will explore challenges, build on your strengths, and work toward meaningful healing, personal growth, and lasting positive change.
14 Years Experience
Online in Cibolo, TX (Online Only)

Serving Native American
Tamara C. Taylor
Licensed Professional Counselor, LPC, NCC, MCHC, ASDCS
As a Licensed Professional Counselor with board certification, Master Certified Health Coach and Autism Spectrum Disorder Clinical Specialist with 19+ years of experience, I want to hear your story. Why? Because it is your story and you deserve to tell it. Your story could be about happiness, love, hurt, anger, stress, anxiety, depression, life transitions and grief just to name a few. Sometimes all anyone wants to do is tell someone caring and compassionate their perspective regarding their story. As a therapist, I believe in giving everyone I meet a clean, unbiased slate. No judgment here. I will use a holistic (mind and body), open-minded and solution-focused approach in assisting anyone in telling their story, processing the events and moving forward with their life goals. I will support and at times coach you on practical ways to build tools to help you navigate this thing we call life.
19 Years Experience
Online in Cibolo, TX (Online Only)
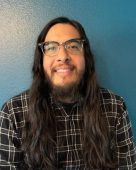
Serving Native American
David Arias
Licensed Professional Counselor, LPC
With over 10 years of experience as a licensed counselor, I am passionate about helping individuals navigate life's challenges and lead more fulfilling lives. I specialize in treating anxiety and depression, providing compassionate, evidence-based therapy tailored to each person's unique needs.
10 Years Experience
In-Person Near Cibolo, TX
Online in Cibolo, TX

Serving Native American
Jason Hutchings
Psychologist, PsyD
My initial interest in psychotherapy was sparked by studies in history, music, visual art, and the major world religions. These seemingly disparate interests helped me understand individual narratives in the context of our larger collective history. We all have a sense of who we are and how the world works based on years of lived experience. By deepening the understanding of our personal narrative we prepare the way for a sense of meaning and purpose that can impact our lives and those around us in profound ways.
13 Years Experience
Online in Cibolo, TX

Serving Native American
Kingdom Dwelling Christian Counseling
Licensed Professional Counselor
We promise to be there for you every step of your journey. Our goal is to help you grow from your struggles, heal from your pain, and move forward to where you want to be in your life. We are committed to providing you with the highest quality of care, rooted in compassion, integrity, and faith. Offering guidance, support, and hope every step of the way. KDCC is your safe place for a wounded heart.
7 Years Experience
Online in Cibolo, TX
Native American therapists in Cibolo, TX Statistics
Native American therapists in Cibolo, TX average 15 years of experience and charge around $197 per session. 100% offer online sessions. The most commonly treated issues are Anxiety or Fears (90%), Depression (82%), and Trauma and PTSD (69%).
Average years in practice
15 Years Experience
Average cost per session
$197
Accept insurance
53%
Offer sliding scale
48%
Gender ID
| 66% |
Female |
|
| 32% |
Male |
|
| 1% |
Gender Fluid |
|
| 1% |
Non-Binary |
|
Session Type
| 58% |
Online Only |
|
| 42% |
In Person and Online |
|
Top Specialties
| 90% | Anxiety or Fears |
| 82% | Depression |
| 69% | Trauma and PTSD |
| 66% | Loss or Grief |
| 58% | Self Esteem |
| 55% | Stress |
| 50% | Divorce |
Ages Served
| 100% | Adult |
| 87% | Young Adult |
| 79% | Senior |
| 48% | Teen |
| 23% | Children |
Client Focus
| 100% | Native American |
| 90% | Women |
| 85% | Hispanic / Latino |
| 84% | Black / African American |
| 79% | Men |