Biopsychosocial therapists in South Jordan, UT
Browse Biopsychosocial therapists in South Jordan, Utah. Compare credentials, specialties and therapeutic approach. Contact a therapist to learn more.

Biopsychosocial
Wellspring Healing and Therapy
Marriage and Family Therapist, LMFT, CMHC, LCSW
At Wellspring Healing, we want to help you connect more deeply with yourself, the people you love, and your community. Our individual therapists are trained in evidence-based therapy practices to help you build a nurturing relationship with the parts of you that feel shamed, buried, or overburdened so you can reconnect with compassion, strength, and joy. Our marriage and family therapists are experienced in helping people improve the intimacy and closeness of romantic relationships by overcoming painful relationship patterns. Reach out today for a free consultation to see if one of our team members can be a guide towards your own internal Wellspring.
2 Years Experience
In-Person Near South Jordan, UT
Online in South Jordan, UT
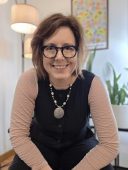
Biopsychosocial
Dr. Dawnn R. Meiers
Psychologist, Psy.D.
Currently accepting clients! My approach is grounded in 25+yrs of experience as a psychotherapist and community educator. I’m passionate about helping people grow through the tough stuff – and also thrive during messy or dark life seasons, with interventions drawn from the research-supported "third wave" of cognitive-behavioral therapy, which includes mindfulness and acceptance approaches, in addition to existential therapy, positive psychology, and nature prescriptions. Expect invitations for behavioral "experiments," culturally-relevant self-help resources, and client-centered compassionate care. Schedule a free 15 minute consultation to discuss your needs today.
19 Years Experience
Online in South Jordan, UT (Online Only)

Biopsychosocial
Dr. Annette Tardif
Psychologist, PhD, MA
Hi, I'm Dr. Annette Tardif, a licensed Counseling Psychologist who is passionate about guiding women in pain towards their best lives. I believe you deserve to find freedom in your circumstances and live to your fullest potential. Pain shouldn’t stop you. I use interventions that impact the whole you, are informed by social justice and up-to-date research, and are realistic to use.
8 Years Experience
Online in South Jordan, UT (Online Only)
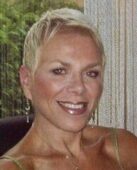
Biopsychosocial
Sarita R. Schapiro, Ph.D., P.A.
Psychologist, Florida Licensed Psychologist PY4914, APIT Certified
I am a Florida licensed Psychologist with over 40 years experience. I offer a solution focused approach to achieve emotional wellness. I am a bi-lingual (Spanish/English) therapist working with teens and adults, families and couples. My practice also includes psychological and neuropsychological evaluations.
44 Years Experience
Online in South Jordan, UT

Biopsychosocial
CELACare
Counselor/Therapist, Roselle O'Brien, LMHC
Hello! I'm Roselle, an LMHC with CELACare. My specialty areas include long COVID, MCAS, chemical sensitivities, EDS, chronic fatigue, chronic illness, anxiety, depression, grief and loss, ADHD. Life can be challenging and unpredictable. Taking that first step towards therapy can often be a little scary. You're not alone. Whatever your goals might be, let's work together to reach them!
13 Years Experience
Online in South Jordan, UT (Online Only)
Biopsychosocial Therapy therapists in South Jordan, UT Statistics
Biopsychosocial Therapy therapists in South Jordan, UT average 17 years of experience and charge around $220 per session. 100% offer online sessions. The most commonly treated issues are Anxiety or Fears (95%), Depression (69%), and Stress (69%).
Average years in practice
17 Years Experience
Average cost per session
$220
Accept insurance
36%
Offer sliding scale
40%
Gender ID
| 80% |
Female |
|
| 20% |
Male |
|
Session Type
| 60% |
In Person and Online |
|
| 40% |
Online Only |
|
Top Specialties
| 95% | Anxiety or Fears |
| 69% | Depression |
| 69% | Stress |
| 67% | Trauma and PTSD |
| 50% | ADHD |
| 50% | Chronic Pain or Illness |
| 50% | Loss or Grief |
Ages Served
| 98% | Adult |
| 62% | Senior |
| 60% | Young Adult |
| 33% | Teen |
| 24% | Children |
Client Focus
| 55% | Women |
| 43% | Men |
| 31% | LGBTQ+ |
| 29% | Military / Veterans |
| 26% | Persons with Disabilities |