Native American therapists in Laurel, VA
Browse Native American therapists in Laurel, Virginia. Compare credentials, specialties and therapeutic approach. Contact a therapist to learn more.

Serving Native American
Natalie Campbell
Psychologist, PsyD; LLC
I've been a Clinical Psychologist since 1997 and love this work! It's a privilege to trudge the road to happy destiny with individuals who aspire to
29 Years Experience
Online in Laurel, VA (Online Only)

Serving Native American
Alex Kawliche
Licensed Mental Health Counselor, LMHC
Hello, I'm Alex Kawliche, and I warmly welcome you to a space where your mental health and personal growth are nurtured with the utmost care. Imagine a sanctuary where every aspect of your being is understood and supported, where your challenges are met with compassion and expertise. That's the heart of my counseling service.
8 Years Experience
Online in Laurel, VA

Serving Native American
Dr. Allison Williams
Psychologist, Psy.D.
I specialize in helping those who are anxious and overwhelmed learn to recognize and honor their needs - it may mean: giving yourself permission to slow down, scale back, set healthy boundaries, go after what you truly want, and be yourself (authentically and unapologetically). As your partner on this journey, I’ll help you muster your strength, foster your self-acceptance, and feel more at ease.
If you’ve always cast aside your own needs to give everyone and everything your all, I want to help you finally get what you deserve: better relationships, self-care, and greater life satisfaction.
10 Years Experience
Online in Laurel, VA (Online Only)

Serving Native American
Dr. Brandi Norman
Psychologist, Clinical Psychologist, Post-Degree Certificate Marriage and Family Therapy, PsyPact
I believe that being truly seen, heard, and understood is at the heart of meaningful change. I strive to create a warm, welcoming, and non-judgmental space where you can feel safe being yourself, exploring difficulties emotions and working through life’s challenges at your own pace. I do this while using evidence-based practice. It is my goal to understand you as a whole person—not just the struggles that bring you to therapy. My goal is to help you recognize your strengths, develop greater self-understanding, self-compassion and to build the psychological flexibility to navigate life’s challenges. You deserve a therapeutic relationship grounded in trust, authenticity and compassion, and that is what I work to offer every person who enters my practice.
15 Years Experience
Online in Laurel, VA
Serving Native American
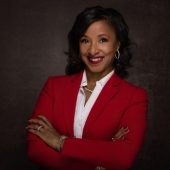
Dr. Shannon Jordan
Licensed Clinical Social Worker, LCSW-C, LICSW
Are you dealing with stress, relationship issues, mood disorders, career/professional concerns, or life transitions? Are you feeling overwhelmed and imbalanced? When this happens, everything else suffers, from your personal to your professional life, including how you feel. You may find it challenging to find the right therapist who can help you heal. Just know that you are not alone. It can be difficult to seek therapy, especially if you tried it before and felt like it didn't work. “One size does not fit all.” My approach is tailored to help you find long-lasting solutions.
15 Years Experience
Online in Laurel, VA (Online Only)
Native American therapists in Laurel, VA Statistics
Native American therapists in Laurel, VA average 16 years of experience and charge around $233 per session. 100% offer online sessions. The most commonly treated issues are Anxiety or Fears (89%), Depression (75%), and Loss or Grief (70%).
Average years in practice
16 Years Experience
Average cost per session
$233
Accept insurance
41%
Offer sliding scale
43%
Gender ID
| 58% |
Female |
|
| 30% |
Male |
|
| 7% |
Non-Binary |
|
| 5% |
Gender Fluid |
|
Session Type
| 59% |
Online Only |
|
| 41% |
In Person and Online |
|
Top Specialties
| 89% | Anxiety or Fears |
| 75% | Depression |
| 70% | Loss or Grief |
| 64% | Trauma and PTSD |
| 61% | Self Esteem |
| 52% | Stress |
| 50% | Divorce |
Ages Served
| 100% | Adult |
| 91% | Young Adult |
| 82% | Senior |
| 34% | Teen |
| 18% | Children |
Client Focus
| 100% | Native American |
| 93% | Women |
| 91% | Hispanic / Latino |
| 84% | Black / African American |
| 82% | Asian |