Christian Counseling in Lynchburg, VA
Browse Christian Counseling in Lynchburg, Virginia. Compare credentials, specialties and therapeutic approach. Contact a therapist to learn more.

Christian
Jordan Johnson, Creating Connection PLC
Licensed Professional Counselor, MA, LPC(WI), LPC(VA), LPCC(MN)
As a Christian, I aim to integrate my deeply held beliefs and worldview into the work that I do in helping people to find peace and hope. While my beliefs influence how I work with others, I do not use my beliefs to try to persuade those who believe differently than I do that they should take on my beliefs as their own. I am very comfortable talking with individuals that have different faith beliefs than I do and I enjoy learning about other people's faith journeys and traditions.
15 Years Experience
Online in Lynchburg, VA (Online Only)

Christian
Aryn Ziehnert
Psychologist, Ph.D.
You don't have to choose between psychological care and your faith. As a Christian psychologist, I offer a compassionate space for individuals seeking to process personal, emotional, or relational challenges through a lens that holds true to your beliefs.
4 Years Experience
Online in Lynchburg, VA

Christian
Marie Paddock, LPC
Licensed Professional Counselor, LPC, NCC, BC-TMH, EMDR
Religion and spirituality can be deeply emotional and conflictual topics for many individuals. I am a licensed professional counselor and I create a safe space for clients to share and discuss their personal beliefs. I do not discuss my personal Christian beliefs with clients.
19 Years Experience
Online in Lynchburg, VA
Christian
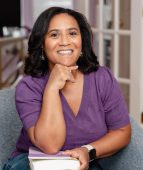
Dr. Brandee Zettel
Marriage and Family Therapist, LMFT, LPC
For clients seeking Christian counseling, I integrate biblical principles with evidence-based practices. I meet you, the client, where you are in your walk with God, and we discuss what areas of spiritual growth you desire in this stage of life and in your relationships.
11 Years Experience
Online in Lynchburg, VA (Online Only)

Christian
Clear Path Counseling and Wellness Center
Licensed Professional Counselor, MA. LPC
I work with clients who struggle with anxiety, depression, trauma, relationship or family issues and I offer faith-based Christian therapy in addition to traditional therapy. During our sessions, we will collaborate to create a plan for addressing them that helps you resolve such issues in a meaningful manner to restore functioning enabling and empowering you to move beyond your past. I practice from a Holistic perspective and commonly employ EMDR and other effective modalities with helping clients achieve balance and purpose in their lives and creative solutions to their problems. This includes exploring past issues and trauma that may be a factor presently. Our goal is to make lasting and desired changes to promote healthy relationships and positive interactions.
I also specialize in Religious Trauma for those who have suffered trauma within Religion or Church in a variety of contexts.
28 Years Experience
Online in Lynchburg, VA (Online Only)
Christian Counseling therapists in Lynchburg, VA Statistics
Christian Counseling therapists in Lynchburg, VA average 15 years of experience and charge around $177 per session. 100% offer online sessions. The top treatment approaches are Cognitive Behavioral Therapy (CBT) (78%), Christian Counseling (70%), and Solution-Focused Brief Therapy (SFBT) (46%).
Average years in practice
15 Years Experience
Average cost per session
$177
Accept insurance
50%
Offer sliding scale
41%
Gender ID
| 65% |
Female |
|
| 27% |
Male |
|
| 5% |
Non-Binary |
|
| 3% |
Gender Fluid |
|
Session Type
| 63% |
In Person and Online |
|
| 37% |
Online Only |
|
Top Treatment Approaches
| 78% | Cognitive Behavioral Therapy (CBT) |
| 70% | Christian Counseling |
| 46% | Solution-Focused Brief Therapy (SFBT) |
| 41% | Emotionally Focused Therapy (EFT) |
| 39% | Behavioral Therapy |
| 37% | Family Systems Therapy |
| 37% | Person-Centered Therapy (Rogerian) |
Ages Served
| 100% | Adult |
| 67% | Young Adult |
| 59% | Senior |
| 48% | Teen |
| 41% | Children |
Client Focus
| 80% | Christian |
| 78% | Women |
| 57% | Men |
| 41% | Black / African American |
| 41% | Military / Veterans |