LGBTQ+ Issues therapists in Eau Claire, WI
Browse LGBTQ+ Issues therapists in Eau Claire, Wisconsin. Compare credentials, specialties and therapeutic approach. Contact a therapist to learn more.
LGBTQ+
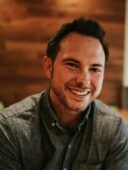
Dr. Mike Strand
Psychologist, PsyD
Members of the LGBTQ+ community often face unique challenges, from navigating personal identity and acceptance to confronting societal prejudice and discrimination. These experiences can lead to feelings of isolation, anxiety, and stress, impacting mental health and well-being. My LGBTQ+ affirming therapy creates a safe and supportive space to explore these issues, offering understanding, validation, and strategies for coping and thriving, embracing your true self with pride and confidence.
18 Years Experience
Online in Eau Claire, WI

LGBTQ+
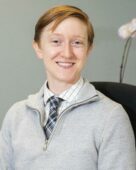
Hannah Muetzelfeld
Psychologist, PhD
I am a gender-affirming and queer-affirming therapist, and promote openness and acceptance in my practice. I greatly enjoy working with queer and gender-expansive clients, and strive to create a space where individuals can feel safe, seen, and celebrated in their identities. I offer trans-affirmative care, and have worked with several clients at various stages through their gender identity journey. I also have experience with letter-writing for gender affirming services in alignment with WPATH standards, and approach this process collaboratively and respectfully.
12 Years Experience
Online in Eau Claire, WI (Online Only)
LGBTQ+
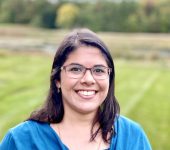
Dr. Caroline Hicks
Psychologist, PhD, LP
Sexual orientation and gender identity development are my areas of focus, and we use this space to make sure all intersecting identities (e.g., racial, religious, political, national) are considered as you find your authentic path in the world. This space is one where we can focus on your sexual orientation and/or gender identity development, or use these identities as a source of context to our work. In addition, I work with many trans*, non-binary, gender nonconforming, gender fluid, and other gender expansive folx as they embark on their path of congruence. In addition, I write letters of support for gender affirming surgeries/medical procedures.
9 Years Experience
Online in Eau Claire, WI (Online Only)
LGBTQ+
Veena Tripathi Ahuja, MD
Psychiatrist, M.D.
Dr. Ahuja has had extensive training and experience with the LGBTQ+ population. Her practice is person-focused and honors the patient's preferred name and pronouns.
18 Years Experience
Online in Eau Claire, WI (Online Only)
LGBTQ+
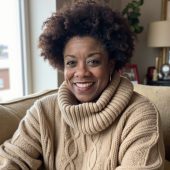
Dr. Kimberly E. Johnson
Psychologist, PsyD, HSPP, APIT
I have worked with LGBTQ clients for over a decade and consider myself an Ally. I am in tune to the unique challenges, bias and issues faced by this population. All to frequently LGBTQ clients all have been subject to trauma, disconnection from family, work or social discrimination based on their gender and sexual identity. Whether dealing with individual, partner or family issues I am an experienced resource.
19 Years Experience
Online in Eau Claire, WI (Online Only)
LGBTQ+ Issues therapists in Eau Claire, WI Statistics
LGBTQ+ Issues therapists in Eau Claire, WI average 15 years of experience and charge around $210 per session. 100% offer online sessions. The top treatment approaches are Cognitive Behavioral Therapy (CBT) (68%), Acceptance & Commitment Therapy (ACT) (40%), and Psychodynamic Therapy (39%).
Average years in practice
15 Years Experience
Average cost per session
$210
Accept insurance
35%
Offer sliding scale
36%
Gender ID
| 59% |
Female |
|
| 33% |
Male |
|
| 5% |
Non-Binary |
|
| 3% |
Gender Fluid |
|
Session Type
| 54% |
In Person and Online |
|
| 46% |
Online Only |
|
Top Treatment Approaches
| 68% | Cognitive Behavioral Therapy (CBT) |
| 40% | Acceptance & Commitment Therapy (ACT) |
| 39% | Psychodynamic Therapy |
| 36% | Existential / Humanistic Therapy |
| 35% | Multicultural Therapy |
| 34% | Relational Psychotherapy |
| 32% | Person-Centered Therapy (Rogerian) |
Ages Served
| 99% | Adult |
| 77% | Young Adult |
| 55% | Senior |
| 41% | Teen |
| 19% | Children |
Client Focus
| 83% | LGBTQ+ |
| 64% | Women |
| 53% | Men |
| 34% | Black / African American |
| 32% | Hispanic / Latino |