Psychosocial therapists in Desert Hot Springs, CA
Browse Psychosocial therapists in Desert Hot Springs, California. Compare credentials, specialties and therapeutic approach. Contact a therapist to learn more.
Psychosocial
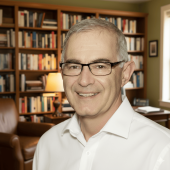
Dennis Sapire
Psychologist, JD PhD
My extensive training and years of experience are a strength. My PhD is in Clinical Health Psychology which means I am hospital trained and have specialized training in medical, sexual, and sport psychology as well as general Clinical Psychology. Further study led to an additional certification in Clinical Sexology. Regular attendance at national conventions helps me keep abreast of innovative treatments. My Biofeedback training informs my treatment of stress and anxiety. My background in law and business have been found helpful by many clients coping with crises of retirement and attempting to overcome financial anxiety.
24 Years Experience
In-Person Near Desert Hot Springs, CA
Online in Desert Hot Springs, CA
Psychosocial
Dr. Claire Vines, Psy.D., Psychologist / Licensed /Psychotherapy / Psychoanalytic/
Marriage and Family Therapist, Marriage, Couples, LMFT. Psy.D. Trauma-Focused CBT
I assist adults in managing confusing emotions related to challenging life events, and away from negativity, to a more positive improved focus. The path to Emotional healing is Emotional Freedom leading to emotional wisdom. You will find the tools to better cope with symptoms related to anxiety, depression and unresolved conflicts.
21 Years Experience
In-Person Near Desert Hot Springs, CA
Online in Desert Hot Springs, CA

Psychosocial
Rich Painter, M.S.
Marriage and Family Therapist, LMFT
Do you want a deeper sense of connection or a greater sense of purpose in life? You may be dealing with stress, fear, marriage issues, dating difficulties, confusion, life transitions, low self worth, career direction, or something else impacting your life and relationships. You might have a mistrust of men or women based on past, hurtful experiences. You are not alone. Imagine yourself living with greater peace, freedom, trust, creativity, courage, and empowering love. Getting you there is my specialty. With your life experience and my 20+ years of training and experience, we can team up to make your life and relationships more fulfilling. With my guidance, fear will be overcome, self-esteem will grow, and understanding will emerge. You can have the loving relationships you deserve, and the life purpose you desire. My clients often say they appreciate the calm demeanor and trust they feel with me. Together, we can help you craft the authentic life you were meant to live.
I'm a Licensed Marriage and Family Therapist #114765 by the state of California and #3281 by the state of Florida. I offer professional counseling, life coaching, and spiritual direction for individuals, couples, children and families. I draw on the insights of psychological theory as well as spiritual resources for healing. I believe that by exploring unmet needs from the past, people can develop healthier relationships today. By working through painful losses and wounds, people can release unhelpful beliefs about themselves and others in order to live more fully in the present and with hope for the future. We are hurt in relationships; we are also healed in relationship, and the therapeutic relationship can be a useful resource. Areas of focus include couple, marital, and singlehood issues, family/parenting dynamics and attachment, anxiety, depression, adolescents and young adults, career coaching, abuse and trauma, spiritual growth and struggles, gender and sexuality issues, loss and grief, and pornography/addictions. I'm a certified Prepare-Enrich Counselor and offer premarital and marital couples counseling, and I'm also a certified Family Wellness Instructor. I'm a professional member of the American Association for Marriage and Family Therapy as well as the California Association of Marriage and Family Therapists. My approach integrates Attachment Theory, Family Systems, Cognitive-Behavioral Therapy, and Life Coaching, and is collaborative, supportive, non-judgmental, and tailored to fit your needs. If you are ready to take the next step I am here to support and empower you. I look forward to working with you!
14 Years Experience
Online in Desert Hot Springs, CA
Psychosocial
Dr. Aleksandra Drecun
Psychologist, Psy.D.
My therapeutic style is collaborative, authentic, compassionate and client-centered. I am committed to providing the highest quality of care. I provide a safe, caring and nonjudgmental environment that centers on client needs. Each therapy session promotes personal growth and success!
25 Years Experience
Online in Desert Hot Springs, CA

Psychosocial
Lori Karny LCSW
Licensed Clinical Social Worker, Psychotherapist, Licensed Clinical Social Worker and MSG, Masters in Gerontology
I have been in practice as a clinican for over 20 years and appreciate the opportunity and interaction developed within the therapeutic relationship. I value the opportunity to help people during a time of need, interpersonal challenges. During my career I have counseled children, youth, survivors of sexual/physical abuse. I was a Clinical Supervisor or Program Director at several non-profit organizations. I also worked at the UCLA Neuropsychiatric Hospital in the Outpatient Adult Psychiatry Program where I provided psychotherapy for adults of all ages and diverse backgrounds. I have also counseled men and women with miltary service history, and volunteered to provide DACA students free therapy for 4 years through a unique program.
20 Years Experience
Online in Desert Hot Springs, CA (Online Only)
Psychosocial Therapy therapists in Desert Hot Springs, CA Statistics
Psychosocial Therapy therapists in Desert Hot Springs, CA average 21 years of experience and charge around $238 per session. 100% offer online sessions. The most commonly treated issues are Anxiety or Fears (82%), Depression (73%), and Relationship and Marriage Counseling (73%).
Average years in practice
21 Years Experience
Average cost per session
$238
Accept insurance
32%
Offer sliding scale
45%
Gender ID
| 65% |
Female |
|
| 27% |
Male |
|
| 4% |
Gender Fluid |
|
| 4% |
Non-Binary |
|
Session Type
| 64% |
In Person and Online |
|
| 36% |
Online Only |
|
Top Specialties
| 82% | Anxiety or Fears |
| 73% | Depression |
| 73% | Relationship and Marriage Counseling |
| 68% | Trauma and PTSD |
| 64% | Loss or Grief |
| 59% | Self Esteem |
| 55% | Stress |
Ages Served
| 100% | Adult |
| 64% | Senior |
| 64% | Teen |
| 36% | Children |
| 36% | Young Adult |
Client Focus
| 59% | LGBTQ+ |
| 59% | Women |
| 45% | Asian |
| 41% | Black / African American |
| 41% | Hispanic / Latino |