HIV/AIDS therapists in Linda, CA
Browse HIV/AIDS therapists in Linda, California. Compare credentials, specialties and therapeutic approach. Contact a therapist to learn more.

HIV/AIDS
Psychotherapy.Com
Psychologist, Ph.D.
HIV/AIDS counseling
30 Years Experience
Online in Linda, CA

HIV/AIDS
Jesse Whittle-Utter
Marriage and Family Therapist, M.A., Licensed Marriage and Family Therapist #79783
I have run groups for gay men with HIV/AIDS and am familiar with the complex emotional and interpersonal issues that come with living with this diagnosis.
18 Years Experience
Online in Linda, CA
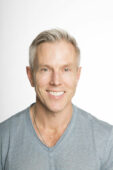
HIV/AIDS
David Strah
Marriage and Family Therapist, MA, LMFT
I have worked with several HIV+ clients
Online in Linda, CA

HIV/AIDS
Misty Johnson
Counselor/Therapist, LCSW
I have been working with community members living with HIV/AIDS for many years
8 Years Experience
Online in Linda, CA

HIV/AIDS
Bonnie Rae
Marriage and Family Therapist, MA, LMFT
I was trained at the Los Angeles Gay & Lesbian Center in 2012, where I received numerous trainings and had experience in working with people with HIV and AIDS.
14 Years Experience
Online in Linda, CA
HIV/AIDS therapists in Linda, CA Statistics
HIV/AIDS therapists in Linda, CA average 18 years of experience and charge around $240 per session. 100% offer online sessions. The top treatment approaches are Cognitive Behavioral Therapy (CBT) (68%), Behavioral Therapy (42%), and Existential / Humanistic Therapy (42%).
Average years in practice
18 Years Experience
Average cost per session
$240
Accept insurance
26%
Offer sliding scale
37%
Gender ID
| 57% |
Male |
|
| 30% |
Female |
|
| 9% |
Non-Binary |
|
| 4% |
Gender Fluid |
|
Session Type
| 74% |
In Person and Online |
|
| 26% |
Online Only |
|
Top Treatment Approaches
| 68% | Cognitive Behavioral Therapy (CBT) |
| 42% | Behavioral Therapy |
| 42% | Existential / Humanistic Therapy |
| 42% | Person-Centered Therapy (Rogerian) |
| 42% | Psychodynamic Therapy |
| 42% | Relational Psychotherapy |
| 42% | Solution-Focused Brief Therapy (SFBT) |
Ages Served
| 100% | Adult |
| 84% | Senior |
| 47% | Young Adult |
| 37% | Teen |
| 26% | Children |
Client Focus
| 84% | LGBTQ+ |
| 53% | Men |
| 53% | Women |
| 42% | Asian |
| 42% | Persons with Disabilities |