LGBTQ+ therapists in Fort Collins, CO
Browse LGBTQ+ therapists in Fort Collins, Colorado. Compare credentials, specialties and therapeutic approach. Contact a therapist to learn more.
Serving LGBTQ+
Empowering Hope
Marriage and Family Therapist, Rachel LMFT, Kady MFTC, Jessica LPCC, Johanna LPCC, Emily LPCC, Andrea intern
Humans are built to heal, and that's what we strive for at Empowering Hope. We are not here to force change, but to help guide and help you on your journey to healing, growth, and self improvement.
6 Years Experience
In-Person in Fort Collins, CO 80526
Online in Fort Collins, CO

Serving LGBTQ+
Glenn Permar
Licensed Professional Counselor, LPC
You may be the reliable one, the person others count on, even as your mind rarely slows down. Over time, carrying pressure without space to reset can leave you tense, reactive, or quietly exhausted. You don’t have to be in crisis to want things to feel steadier. Sometimes it’s simply time to stop holding everything alone.
6 Years Experience
Online in Fort Collins, CO (Online Only)
Serving LGBTQ+
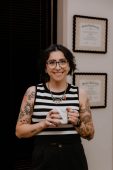
Ry Shavlik
Counselor/Therapist, MSW, LSW
Hi, I'm Ry, and I'm glad that you're here. I know that sounds cheesy (and it kinda is), but seeking out therapy services takes a lot of courage. As a therapist, I am pretty laid-back, goofy, and genuine. Some people prefer a very textbook “professional” therapist, and honestly, that is not me. I dress in casual clothes and sometimes (or a lot of the time) even swear in session. I show up as my full authentic, dorky self. I can't wait to meet your authentic self in my space as well.
6 Years Experience
In-Person in Fort Collins, CO 80526
Online in Fort Collins, CO

Serving LGBTQ+
Carolyn Duhn
Counselor/Therapist, Licensed Professional Counselor
Maybe your life is feeling like a rollercoaster — exciting, confusing, overwhelming, and everything in between. Whether you're navigating school, work, relationships, identity, or just trying to figure out who you are and where you're headed, you're not alone. This phase of life comes with a lot of change, and it’s totally normal to need some support along the way. I'm here to offer a space where you can talk things through, feel seen, and build tools to feel more grounded and confident. We can meet online, so therapy fits into your life — wherever you’re at.
16 Years Experience
Online in Fort Collins, CO (Online Only)

Serving LGBTQ+
Dr. Stacie McPherson
Psychologist, M.A., Psy.D., Licensed Psychologist
If you've left an abusive or narcissistic relationship, you may have survived it by learning to support everyone but yourself. You learned to anticipate others’ emotions to keep the peace and to say yes all the time, but these things come at a cost. The self-doubt runs deep and you still replay conversations wondering if you’re the problem.
With over 10 years of experience, I specialize in helping people heal from toxic relationships. The people-pleasing that once kept you safe, and the self-doubt it left behind aren't permanent. You can take back the power you lost in that relationship!
You're human. And you're more powerful than the story you've been telling yourself. Therapy isn't just about learning to cope better. It's about reclaiming YOUR power. Power that got buried under everyone else's needs, bad relationships, and the constant pressure to hold it all together.
10 Years Experience
Online in Fort Collins, CO (Online Only)
Serving LGBTQ+
Ignite Counseling Colorado
Licensed Clinical Social Worker, LPC, LCSW, LMFT, CSAT
Ignite Counseling Colorado is an award-winning counseling practice serving clients in Westminster, Denver, and Longmont, with secure online therapy available throughout Colorado for accessible, convenient care. Specializing in OCD, trauma, depression, and addiction treatment, Ignite’s experienced clinicians provide compassionate support for children ages 6–17, adults, and families seeking meaningful change and lasting relief. The practice accepts a wide range of insurance plans, including Medicaid and Medicare, to help reduce barriers to quality mental health care. Recognized for excellence, Ignite was voted Best Mental Health Practice in Westminster and named a finalist for Best Mental Health in Colorado.
7 Years Experience
In-Person Near Fort Collins, CO
Online in Fort Collins, CO
LGBTQ+ therapists in Fort Collins, CO Statistics
LGBTQ+ therapists in Fort Collins, CO average 14 years of experience and charge around $204 per session. 100% offer online sessions. The most commonly treated issues are Anxiety or Fears (79%), Depression (64%), and Trauma and PTSD (62%).
Average years in practice
14 Years Experience
Average cost per session
$204
Accept insurance
43%
Offer sliding scale
40%
Gender ID
| 63% |
Female |
|
| 28% |
Male |
|
| 6% |
Non-Binary |
|
| 3% |
Gender Fluid |
|
Session Type
| 54% |
In Person and Online |
|
| 46% |
Online Only |
|
Top Specialties
| 79% | Anxiety or Fears |
| 64% | Depression |
| 62% | Trauma and PTSD |
| 58% | Stress |
| 55% | LGBTQ+ Issues |
| 52% | Loss or Grief |
| 49% | Self Esteem |
Ages Served
| 99% | Adult |
| 76% | Young Adult |
| 53% | Senior |
| 40% | Teen |
| 17% | Children |
Client Focus
| 100% | LGBTQ+ |
| 81% | Women |
| 61% | Men |
| 39% | Hispanic / Latino |
| 38% | Black / African American |