Native American therapists in Montville Center, CT
Browse Native American therapists in Montville Center, Connecticut. Compare credentials, specialties and therapeutic approach. Contact a therapist to learn more.

Serving Native American
Eagle Feather Psychotherapy
Licensed Clinical Social Worker, LCSW, LICSW
Natasha is Founder/Owner, of Eagle Feather Psychotherapy & has over 11 years of experience as a professional clinical therapist. She helps, individuals and couples function at their best, in their healing journey. Natasha supports individuals who seek positive change in their life, learn to become healthier & more empowered and her goal is to help patients thrive, and achieve balance.
Natasha provides treatment in a comfortable safe space and ensures individuals are respected.
Natasha supports people in their mental health journey by helping them address unwanted symptoms & personal life issues, including relationships, family, work, home & school. She is a creative, warm, supportive clinical therapist & her goal is to provide treatment with a culturally competent mental health treatment approach that is individualized.
12 Years Experience
Online in Montville Center, CT (Online Only)

Serving Native American
Dr. Sonia Ovuehor Ovy
Counselor/Therapist, Doctor of science in Counselling Psychology, Msc Conflict Resolution, Advanced Diploma in Psychotherapy, Counselling and Cognitive Behavioral Therapy, Certificate in Mental Health Studies, Suicide Prevention and Intervention, Diploma in Relationship and Family Counselling, CPD in Neuro Linguistic Programming.
I am a globally certified relationship and marriage coach, licensed Counsellor, seasoned Therapist. My years of hands-on experience cut across relationship therapy, marital counselling, business coaching, career mentorship, grief/trauma/addiction recovery, etc.
I possess grandiose expertise in listening, absorbing and analyzing human problems without prejudice. As an individual who has experienced life from all angles (right from a tender age), I am apparently in a better position to counsel and admonish individuals who battle with depression, anxiety, retrogression/set backs, financial turmoils, addiction, emotional/domestic abuse, rejection, youthful exuberance, juvenile delinquency, child abuse, marital/family crisis, etc.
My professional background makes me capable of being a great confidant and less judgmental. My sense of humor often gives my clients a soothing sigh of relief, irrespective of the burden at hand.
I also provide spiritual counselling services for deeper issues beyond basic comprehension.
9 Years Experience
Online in Montville Center, CT (Online Only)

Serving Native American
Nancy Hayes-Gary, Psy.D.
Psychologist, Licensed Psychologist, MD , Psy.D.
I have been a psychologist in trauma work for many years, thus I can tailor my approach to meet your needs. Different ages and developmental stages throughout the life span require differing approaches. People generally wait to start therapy until their symptoms are really bothersome. I am currently accepting new patients, with no waiting list.
33 Years Experience
Online in Montville Center, CT (Online Only)

Serving Native American
The Adult ADHD Clinic
Psychologist, Psyd, PsyPact
The Adult ADHD Clinic offers a streamlined approach to meeting your psychological testing needs. Whether you are seeking clarification regarding a diagnosis of ADHD, require a report for academic accommodations, or are in need of an updated report based on changing needs, The Adult ADHD Clinic is your answer. We are PsyPact certified and our tele-assessment services are available in 43 states.
14 Years Experience
Online in Montville Center, CT (Online Only)
Serving Native American
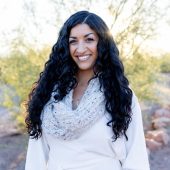
Dr. Amanda Malak
Psychologist, Clinical Psychologist
I believe people can build the lives they want to live by aligning themselves with their values, which may shift with the various seasons of life.
12 Years Experience
Online in Montville Center, CT
Native American therapists in Montville Center, CT Statistics
Native American therapists in Montville Center, CT average 14 years of experience and charge around $233 per session. 100% offer online sessions. The most commonly treated issues are Anxiety or Fears (87%), Depression (74%), and Loss or Grief (69%).
Average years in practice
14 Years Experience
Average cost per session
$233
Accept insurance
33%
Offer sliding scale
51%
Gender ID
| 65% |
Female |
|
| 31% |
Male |
|
| 2% |
Gender Fluid |
|
| 2% |
Non-Binary |
|
Session Type
| 64% |
Online Only |
|
| 36% |
In Person and Online |
|
Top Specialties
| 87% | Anxiety or Fears |
| 74% | Depression |
| 69% | Loss or Grief |
| 62% | Self Esteem |
| 62% | Trauma and PTSD |
| 59% | Stress |
| 51% | ADHD |
Ages Served
| 100% | Adult |
| 90% | Young Adult |
| 72% | Senior |
| 33% | Teen |
| 15% | Children |
Client Focus
| 100% | Native American |
| 95% | Women |
| 87% | Hispanic / Latino |
| 82% | Black / African American |
| 79% | Persons with Disabilities |