Native American therapists in Wright, FL
Browse Native American therapists in Wright, Florida. Compare credentials, specialties and therapeutic approach. Contact a therapist to learn more.

Serving Native American
Keneisha Newland-Brathwaite LCSW, MA. Psy
Licensed Clinical Social Worker, Serenity, Courage & Wisdom Counseling & Consultation
My goal is to assist clients in navigating and healing from past traumas, emotional challenges, and mental health issues. I believe in the power of self-reflection and emotional exploration, and I strive to create a space that promotes healing and self-awareness. To me, therapy should be a supportive and accountable environment where clients feel understood and empowered on their journey to well-being.
9 Years Experience
Online in Wright, FL (Online Only)

Serving Native American
Vincent Espinoza
Licensed Clinical Social Worker, LCSW
My therapy practice is focused on YOU, first and foremost! I believe we are all unique and a culmination of our values, desires, experiences and our untapped potential. My mission as a mental health clinician is to help my clients learn how to talk about sex in a healthy, unapologetic, sex-positive way and to confront and address past trauma so they can move into the present and enjoy a fulfilling life.
12 Years Experience
Online in Wright, FL (Online Only)

Serving Native American
Alex Kawliche
Licensed Mental Health Counselor, LMHC
Hello, I'm Alex Kawliche, and I warmly welcome you to a space where your mental health and personal growth are nurtured with the utmost care. Imagine a sanctuary where every aspect of your being is understood and supported, where your challenges are met with compassion and expertise. That's the heart of my counseling service.
8 Years Experience
Online in Wright, FL
Serving Native American
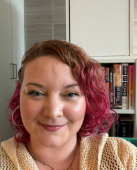
Kate Mageau (she/her)
Licensed Mental Health Counselor, LMHC, ADHD-CCSP, NCC, CIMHP, C-DBT
Hi! I'm Kate (she/her), I'm a Licensed Mental Health Counselor and ADHD-CCSP based in Seattle, WA. I specialize in ADHD, Autism, healing from toxic relationships, and working with LGBTQIA+ people. I bring both clinical expertise and lived experience as an ADHDer, lesbian, and domestic violence survivor to my work. I also offer ADHD and Autism Assessments, gender-affirming and ESA letters, and I wrote Rose-Colored Glasses and the Healing from Toxic Relationships Workbook to help people to start healing on their own, or alongside therapy.
4 Years Experience
Online in Wright, FL (Online Only)

Serving Native American
Dr. John E. N. Daniel
Marriage and Family Therapist, EdD; EdS; MA; MA; LCMFT#0404011018; BCCLC#0131
I utilize "eclectic/integrated" approaches for clients in need of life change. Some of my specialties include: life coaching, marriage/couple & family therapy, anger/career management, depression, anxiety and PTSD. We provide a safe, trusted & confidential client environment. I help clients improve their stress management, coping skills, work-life balance and emotional stability. Many desire "inner healing" from life crisis situations. I also guide clients seeking direction, transformation and accountability by helping them to self-discover their core values, destiny, life purpose, sense of worth, creativity and untapped potential.
26 Years Experience
Online in Wright, FL
Native American therapists in Wright, FL Statistics
Native American therapists in Wright, FL average 15 years of experience and charge around $209 per session. 100% offer online sessions. The most commonly treated issues are Anxiety or Fears (85%), Depression (76%), and Loss or Grief (65%).
Average years in practice
15 Years Experience
Average cost per session
$209
Accept insurance
50%
Offer sliding scale
44%
Gender ID
| 62% |
Female |
|
| 31% |
Male |
|
| 4% |
Non-Binary |
|
| 3% |
Gender Fluid |
|
Session Type
| 58% |
Online Only |
|
| 42% |
In Person and Online |
|
Top Specialties
| 85% | Anxiety or Fears |
| 76% | Depression |
| 65% | Loss or Grief |
| 64% | Self Esteem |
| 64% | Trauma and PTSD |
| 52% | Stress |
| 50% | ADHD |
Ages Served
| 100% | Adult |
| 88% | Young Adult |
| 80% | Senior |
| 44% | Teen |
| 21% | Children |
Client Focus
| 100% | Native American |
| 92% | Hispanic / Latino |
| 92% | Women |
| 85% | Black / African American |
| 82% | Men |