Native American therapists in Milledgeville, GA
Browse Native American therapists in Milledgeville, Georgia. Compare credentials, specialties and therapeutic approach. Contact a therapist to learn more.

Serving Native American
Underwood Counseling & Consultation, PLLC / Lucy F. Underwood
Licensed Professional Counselor, PhD, LPC-S, NCC, ACS, BC-TMH, EMDRIA Certified, Qualified ART
Underwood Counseling & Consultation, PLLC was created with the desire to affect positive change in the lives of those residing in our community. Our commitment and dedication to client care has assisted us in creating a reputation of client success and healing. We provide a safe, supportive, and compassionate environment to process the most challenging emotional concerns. Therapy is a journey that is best traveled together. We understand the effort it takes to reach out for support. Dr. Underwood and Associates are willing to walk alongside you as you heal, encourage you when filled with doubt, and provide accountability when traveling on a new path.
31 Years Experience
Online in Milledgeville, GA

Serving Native American
Philadelphia Couples Therapy
Psychologist, PsyD
We are a collective of couples psychologists united by the shared conviction that relationships deserve more emotional care and community support than our culture provides. Building and sustaining a loving partnership isn’t meant to happen in isolation — it takes a village. In today’s world, we ask more of our partners than ever before. Our partners are our confidants, our co-parents, our lovers, our best friends, and the witnesses to both our strength and our vulnerability. This profound closeness is one of life’s greatest gifts, yet it can also create immense pressure. At PCT, we strive to be that village — a steady emotional anchor for couples navigating the highs and lows of connection.
Every kind of couple is welcome here: those deeply in love, those in conflict, those recovering from betrayal, and those unsure of how to move forward. Together, we help partners rediscover what first drew them together while uncovering new ways to grow intimacy and trust. Our work isn’t about perfection — it’s about helping two people feel seen, understood, and supported as they evolve together.
Sometimes, relationships reach a crossroads. The clinicians at PCT are skilled at holding space for both partners’ perspectives, guiding them through painful or uncertain transitions toward clarity and peace. That might mean learning to co-parent respectfully, parting ways with compassion, or exploring whether staying together is truly right. Even after a breakup, we help couples find a way to relate from steadier ground — because healing, too, is a form of love. We remain beside you for as long as you need, until the storm calms and a new balance emerges.
We also offer individual therapy for those seeking personal growth, clarity, or support. Whether you’re navigating life transitions, managing stress, or simply looking to better understand yourself, our psychologists provide a safe, compassionate space to explore your goals and challenges.
23 Years Experience
Online in Milledgeville, GA

Serving Native American
Clear Path Counseling and Wellness Center
Licensed Professional Counselor, MA. LPC
Life can feel overwhelming when anxiety, trauma, stress, relationship problems, or difficult life transitions begin affecting your emotional well-being and daily life. Therapy provides a safe and supportive space to better understand yourself, heal from past experiences, reduce emotional distress, and create a more meaningful, balanced, and fulfilling life. Many people seek counseling for anxiety, depression, trauma, PTSD, overwhelming emotions, relationship or family issues, grief, burnout, low self-esteem, or simply feeling stuck and disconnected from themselves.
Brad provides trauma-informed counseling and EMDR therapy to help clients identify and resolve the deeper issues contributing to emotional pain, unhealthy patterns, and ongoing stress. Together, you will explore current struggles and past experiences to better understand what may be keeping you feeling overwhelmed, unhappy, or unable to move forward. The goal of therapy is not only symptom relief, but meaningful and lasting healing that helps you regain clarity, confidence, peace, and emotional balance.
Brad takes a holistic and personalized approach to therapy, recognizing that every person’s experiences, needs, and healing process are unique. His counseling style is warm, compassionate, interactive, and non-judgmental, helping clients feel genuinely supported, understood, and empowered throughout the therapeutic process.
Using EMDR therapy (Eye Movement Desensitization and Reprocessing), trauma-focused counseling, and holistic therapeutic approaches, Brad helps clients process unresolved trauma, strengthen emotional resilience, increase self-awareness, and develop healthier ways of coping and relating. Therapy focuses on helping clients break unhealthy patterns, reconnect with their inner strengths, and move beyond the pain of the past so they can live with greater purpose, freedom, and fulfillment.
Healing and positive change are possible. No issue is too small or too overwhelming to address in therapy. With the right support, you can reduce stress, restore hope, build resilience, and create the life and relationships you truly want.
Virtual counseling and online EMDR therapy sessions are available, providing private and convenient access to professional trauma-focused therapy from the comfort of your home.
28 Years Experience
Online in Milledgeville, GA (Online Only)
Serving Native American
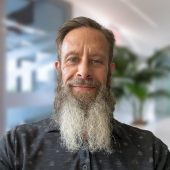
Brian L. Long
Licensed Professional Counselor, LPC, MAC
I offer individual, couples, family and group counseling. I like to provide an environment where clients can navigate, explore and process life's circumstances in a empathic, safe, objective and unbiased manner.
23 Years Experience
Online in Milledgeville, GA (Online Only)
Serving Native American
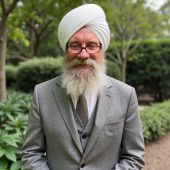
Karambir Khalsa | Khalsa Psychology PLLC
Psychologist, (AZ PSY-005603), Non-Licensed Clinician (CO NLC.0107000)
I create a safe place for you to process your concerns and heal. Sessions are conversational in nature. I want to hear your concerns in your own words and I will reflect back what I am hearing so you can confirm or correct. Our conversations help me to know which techniques are relevant and applicable to your concerns.
3 Years Experience
Online in Milledgeville, GA
Native American therapists in Milledgeville, GA Statistics
Native American therapists in Milledgeville, GA average 18 years of experience and charge around $232 per session. 100% offer online sessions. The most commonly treated issues are Anxiety or Fears (91%), Depression (82%), and Loss or Grief (73%).
Average years in practice
18 Years Experience
Average cost per session
$232
Accept insurance
39%
Offer sliding scale
39%
Gender ID
| 61% |
Female |
|
| 35% |
Male |
|
| 2% |
Gender Fluid |
|
| 2% |
Non-Binary |
|
Session Type
| 59% |
Online Only |
|
| 41% |
In Person and Online |
|
Top Specialties
| 91% | Anxiety or Fears |
| 82% | Depression |
| 73% | Loss or Grief |
| 68% | Trauma and PTSD |
| 64% | Self Esteem |
| 57% | Divorce |
| 55% | Stress |
Ages Served
| 100% | Adult |
| 82% | Young Adult |
| 80% | Senior |
| 39% | Teen |
| 18% | Children |
Client Focus
| 100% | Native American |
| 95% | Women |
| 91% | Hispanic / Latino |
| 84% | Black / African American |
| 80% | LGBTQ+ |