Psychosocial therapists in Saint Charles, Missouri MO
We are proud to feature top rated Psychosocial therapists in Saint Charles. We encourage you to review each profile to find your best match.
Psychosocial
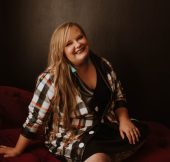
Alternative Access Counseling
Counselor/Therapist, LPC
Amy Studer (she/zir) has a Masters in Rehabilitation Counseling and her LPC from the state of Missouri.
With specialized training in working with human sexuality and gender, disabilities, trauma, chronic pain, neurodivergence, and severe mental health diagnoses, Amy has worked with individuals across the life span (4-90 years old).
4 Years Experience
Online in Saint Charles, MO Missouri (Online Only)
Psychosocial
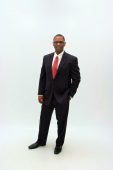
Dr. Christopher Lowery, DHSc, CLCP
Clinical Health Practitioner, Board-Certified Life Care Planner
Dr. Christopher A. Lowery, DHSc, CLCP is board-certified, specializing in international telehealth life care planning with a focus on clinical health, rehabilitation counseling, biopsychosocial issues, and global health promotion and prevention issues through the use of holistic evidence-based approaches using a Biopsychosocial Health Consultation Model and the Universal Neurodiversity Continuum (UNC) Model™. Dr. Lowery is skilled in the use of targeted plans, assessments, and developing treatments for behavioral health disorders (e.g., anxiety, ADHD, depression, emotional regulation, employment, trauma, conduct disorder, anger, substance use, etc.), medical conditions (e.g., chronic pain, burns, high blood pressure, inflammation, lung diseases, and diabetes, etc.), and health behavior changes (e.g., weight management, informed health decisions, occupational health prevention, physical activity, disparities, preventive nutrition, tobacco cessation, risky sexual activity, accident prevention, etc.). Other services also provided are catastrophic and disability case management, and non-expert (lay) witness or non-testifying expert litigation support regarding associated disabilities and/or health impairments.
The Universal Neurodiversity Continuum (UNC) Model™ established by Dr. Lowery, is an evidence-informed framework that understands cognitive, emotional, and behavioral traits as existing along a continuum across all individuals. It shifts the focus from fixed diagnostic categories to how traits are expressed and how they impact daily functioning, allowing for more personalized practical, and inclusive approaches to support and well-being.
Dr. Lowery holds a board-certification in life care planning as a Certified Life Care Planner (CLCP) from the International Commission on Health Care Certification (ICHCC), which is accredited and recognized by the American National Standards Institute National Accreditation Board (ANAB). This prestigious certification attests to his qualifications and competence in the health care delivery systems. ANAB’s accreditation ensures that the certification process meets rigorous international standards, confirming his aptitude and expertise for his role as a practitioner.
24 Years Experience
Online in Saint Charles, MO Missouri
Psychosocial
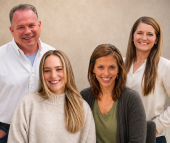
Pathways Counseling KC
Counselor/Therapist, LCPC, LPC, LMFT, IAT Coach
Are you ready to change your life, but feel like nothing you try ever works? Are you tired of feeling this way? Do you want lasting results? At Pathways Counseling KC we understand that true and lasting change needs to take place at the subconscious level. Anything else is simply putting a band-aid on a wound. PCKC provides actionable strategies to target the subconscious and heal unhealthy patterns for good. We work with individuals, couples, and families in the Kansas City area to provide support as you uncover the past, embrace the present, and pursue your best path forward.
We specialize in areas of trauma/complex trauma (PTSD/CPTSD), narcissistic abuse, relationships, anxiety, depression, and overall personal growth. Research proves that in order for real and lasting change to exist, it must take place at the subconscious level. PCKC offers a variety of long-lasting and results-oriented approaches to help you transform your life and relationships. Explore our website to see how we can help you find your path forward.
10 Years Experience
Online in Saint Charles, MO Missouri
Psychosocial
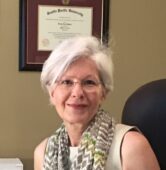
Dr. Leigh Anne Randa
Psychologist, PhD
A human being, by nature, is full of contradictions. I believe a strong therapeutic alliance is essential to the therapy process. The experience of "feeling" seen, or felt, or heard, is the beginning of healing. Knowing that while you are unique, you are not alone. My belief is that strong therapy starts with the therapeutic relationship.
20 Years Experience
Online in Saint Charles, MO Missouri
Psychosocial
Richard Scott, Ph.D.
Psychologist, Ph.D.
Life can be challenging, and sometimes we find ourselves far from where we want to be or struggling to feel the happiness we deserve. Therapy provides a valuable opportunity to reflect, gain clarity, and work toward the life you envision. It’s truly a privilege to help my clients navigate their struggles and create healthier, more fulfilling lives. If you're ready to take that step, I’d be honored to support you on your journey.
20 Years Experience
Online in Saint Charles, MO Missouri
Psychosocial Therapy therapists in Saint Charles, Missouri Statistics
Psychosocial Therapy therapists in Saint Charles, Missouri average 17 years of experience and charge around $206 per session. 100% offer online sessions. The most commonly treated issues are Anxiety or Fears (94%), Depression (89%), and Stress (89%).
Average years in practice
17 Years Experience
Average cost per session
$206
Accept insurance
33%
Offer sliding scale
39%
Gender ID
| 59% |
Female |
|
| 36% |
Male |
|
| 5% |
Non-Binary |
|
Session Type
| 72% |
In Person and Online |
|
| 28% |
Online Only |
|
Top Specialties
| 94% | Anxiety or Fears |
| 89% | Depression |
| 89% | Stress |
| 83% | Self Esteem |
| 78% | Social Anxiety |
| 72% | Trauma and PTSD |
| 72% | ADHD |
Ages Served
| 100% | Adult |
| 78% | Young Adult |
| 50% | Senior |
| 50% | Teen |
| 33% | Children |
Client Focus
| 61% | Women |
| 50% | Men |
| 50% | LGBTQ+ |
| 39% | Military / Veterans |
| 33% | Persons with Disabilities |