Behavioral therapists in Fernley, NV
Browse Behavioral therapists in Fernley, Nevada. Compare credentials, specialties and therapeutic approach. Contact a therapist to learn more.

Behavioral
Allyson Stephens
Licensed Clinical Social Worker, MSW, LCSW
I’m glad you are here. There is a reason you are here, and I understand how vulnerable this can be. It is so brave that you are here and ready to start your healing journey. My name is Allyson Stephens and I specialize in trauma informed care. I have personally healed from generational trauma and done my work in order to better understand myself and how trauma impacts the body and mind.
I am trained in trauma interventions and in the process of getting EMDR certified. I can help you explore what your body is telling you and help explore how to heal from past experiences. I can offer support through trauma, PTSD, anxiety, depression, low self-esteem, trouble having emotions, and many more.
When you come into my office, I want you to be able to be your true self and not have to mask your authenticity. I want you to feel heard, safe, and understood. I look forward to starting this journey with you.
8 Years Experience
Online in Fernley, NV (Online Only)
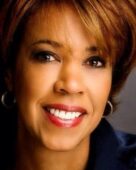
Behavioral
Adrienne O'Neal
Marriage and Family Therapist, MS, MFT
I'M NOT ACCEPTING NEW CLIENTS AT THIS TIME.
I'D BE HAPPY TO REFER YOU TO A THERAPIST IN MY OFFICE AT RED ROCK COUNSELING (OR YOU MAY GO TO THE WEBSITE AND SCHEDULE ONLINE.)
If you're looking for extra support and guidance during a challenging marriage or you're depressed or just ready to move in a new direction in your life, I look forward to working with you to achieve your goals.
The focus of my practice is couples & relationship concerns, abuse survivors, and teens.
22 Years Experience
Online in Fernley, NV

Behavioral
Deidre Jenkins
Marriage and Family Therapist, MS, LMFT, ACS, CIMHP, FNTP, SAP
Life's challenges are only the beginning. Allow me to help you through them. I am an empathetic, good-hearted, and insightful therapist. As a solution-focused therapist, my approach is direct and enhances your communication to others while helping you to focus on what you determine is important.
17 Years Experience
Online in Fernley, NV

Behavioral
Hannah Lehavi
Marriage and Family Therapist, LMFT-Intern
Life’s challenges can leave us feeling unsure of ourselves and where we’re headed. Whether navigating relationship struggles, feeling stuck, or managing overwhelming emotions, these moments can be heavy to carry alone. As your therapist, I provide a warm and nonjudgmental space to explore your experiences, make sense of your feelings, and build stronger connections—with others and yourself. Therapy is your opportunity to process the pressures of life and develop tools to confidently step into a more fulfilling present and future.
5 Years Experience
Online in Fernley, NV

Behavioral
Jessica Torres Kreidt
Counselor/Therapist, LPCC, NCC, CCTP (CA: LPCC#17935)
Life can feel overwhelming, making it hard to find joy. As your counselor, I’m here to make the journey to healing and self-discovery easier. Together, we’ll face tough conversations, overcome challenges, and work toward growth. You don’t have to do it alone—I’m here to support you every step of the way.
7 Years Experience
Online in Fernley, NV (Online Only)
Behavioral Therapy therapists in Fernley, NV Statistics
Behavioral Therapy therapists in Fernley, NV average 16 years of experience and charge around $208 per session. 100% offer online sessions. The most commonly treated issues are Anxiety or Fears (94%), Depression (78%), and Stress (65%).
Average years in practice
16 Years Experience
Average cost per session
$208
Accept insurance
43%
Offer sliding scale
37%
Gender ID
| 67% |
Female |
|
| 30% |
Male |
|
| 3% |
Non-Binary |
|
Session Type
| 54% |
In Person and Online |
|
| 46% |
Online Only |
|
Top Specialties
| 94% | Anxiety or Fears |
| 78% | Depression |
| 65% | Stress |
| 61% | Social Anxiety |
| 54% | Self Esteem |
| 53% | Trauma and PTSD |
| 50% | ADHD |
Ages Served
| 95% | Adult |
| 70% | Young Adult |
| 57% | Senior |
| 54% | Teen |
| 25% | Children |
Client Focus
| 47% | Women |
| 33% | Men |
| 28% | LGBTQ+ |
| 28% | Military / Veterans |
| 21% | Persons with Disabilities |