Interpersonal Therapy (IPT) therapists in Lexington, NC
Browse Interpersonal Therapy (IPT) therapists in Lexington, North Carolina. Compare credentials, specialties and therapeutic approach. Contact a therapist to learn more.

IPT
Dr. Char Houben
Psychologist, PhD, LP
Dr. Houben provides therapy that goes beyond merely treating symptoms and takes a depth-oriented perspective in order for us to examine root causes and incorporate enduring change. She views therapy as a collaborative process, focusing on the therapeutic relationship as a vehicle for self-exploration and change. She understands that your cultural background is an integral part of your identity, so she is dedicated to creating a safe, inclusive, and affirming therapeutic space. With a comprehensive approach to treatment, Dr. Houben recognizes that well-being encompasses the integration of mental, emotional, and physical aspects of health and considers the entirety of your being. In therapy, we will begin a collaborative journey together, exploring the depths of your experiences, fostering psychological flexibility, and facilitating profound personal growth. If you are ready to embrace on this transformative process, I am here to understand your lived experiences and provide you the support, guidance, and expertise you need. Together, we will embark on a path toward self-discovery, healing, and, incorporate lasting positive change.
11 Years Experience
Online in Lexington, NC

IPT
Susanne R Mealer
Licensed Clinical Social Worker, LCSW
Do you feel lost or stuck? Has your life suddenly gone off track or slowed to a stop? Are you ready to put it back in gear?
If you feel you are hanging on by a thread, don't suffer in silence. Together we can work on letting go of what is getting in your way so you can stop just surviving and instead grow and thrive.
18 Years Experience
Online in Lexington, NC (Online Only)

IPT
Lynette Cisneros
Counselor/Therapist, LCMHC, LMHC
Therapy is not a one size fits all discipline. As an experienced therapist I recognize that adaptability is key. Your provider must be able to move within the space of the session with you as things present. This is where my experience & our rapport becomes invaluable. In my practice I strongly believe this space is for and about you. Our dynamic is intended as a tool to heal with compassion, intentionality and humor. When we can laugh we will.
25 Years Experience
Online in Lexington, NC (Online Only)
IPT
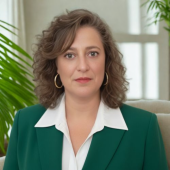
Barbra Rogoff
Licensed Clinical Social Worker, LCSW
I believe that, with a little help, anyone can move past obstacles, achieve their goals, and experience a more fulfilling life. While we can’t prevent difficulties from arising, we can work together to better understand and overcome them. My goal is to help you discover your true self and the life you desire. I'm ready when you are.
19 Years Experience
Online in Lexington, NC (Online Only)

IPT
Lee Chase
Psychologist, Ph.D.
Dr. Chase emphasizes creating a supportive and interactive therapeutic environment that encourages self-exploration, reflection, and problem-solving. She combines compassion, strong attunement, and a sense of humor in her work.
32 Years Experience
Online in Lexington, NC
Interpersonal Therapy (IPT) therapists in Lexington, NC Statistics
Interpersonal Therapy (IPT) therapists in Lexington, NC average 16 years of experience and charge around $207 per session. 100% offer online sessions. The most commonly treated issues are Anxiety or Fears (85%), Depression (71%), and Stress (65%).
Average years in practice
16 Years Experience
Average cost per session
$207
Accept insurance
39%
Offer sliding scale
38%
Gender ID
| 69% |
Female |
|
| 27% |
Male |
|
| 3% |
Non-Binary |
|
| 1% |
Gender Fluid |
|
Session Type
| 60% |
In Person and Online |
|
| 40% |
Online Only |
|
Top Specialties
| 85% | Anxiety or Fears |
| 71% | Depression |
| 65% | Stress |
| 56% | Trauma and PTSD |
| 55% | Self Esteem |
| 50% | Loss or Grief |
| 44% | Social Anxiety |
Ages Served
| 100% | Adult |
| 73% | Young Adult |
| 50% | Senior |
| 31% | Teen |
| 17% | Children |
Client Focus
| 54% | Women |
| 41% | Men |
| 39% | LGBTQ+ |
| 24% | Military / Veterans |
| 20% | Black / African American |