Bipolar Disorder therapists in Lebanon, OR
Browse Bipolar Disorder therapists in Lebanon, Oregon. Compare credentials, specialties and therapeutic approach. Contact a therapist to learn more.
Bipolar
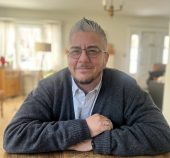
Wyatt Okeefe
Licensed Mental Health Counselor, MA, LMHC, LPC, LPCC
I offer caring support to individuals experiencing bipolar disorder, with an emphasis on understanding mood patterns, developing effective coping strategies, and improving emotional stability. Treatment may address mood changes, stress management, sleep, relationships, self-esteem, and the impact of symptoms on work and daily functioning. I work collaboratively with clients to build greater awareness, develop practical skills, and support long-term stability and well-being.
28 Years Experience
Online in Lebanon, OR (Online Only)
Bipolar
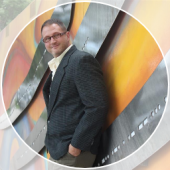
Roderic Burks - Integrative Mental Health
Licensed Mental Health Counselor, MS, MS HSc, MA, LMHC, LPC
I work with clients experiencing bipolar disorder using a trauma-informed, parts-based approach. We explore the underlying patterns and emotional shifts that influence mood and behavior. Together, we develop tools for stabilization, self-awareness, and living in greater balance and clarity.
26 Years Experience
Online in Lebanon, OR (Online Only)
Bipolar
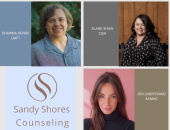
Sandy Shores Counseling
Marriage and Family Therapist, LMFT, ACMHC, CSW, LCSW
We offer supportive, evidence-based therapy for individuals living with bipolar disorder, focusing on mood regulation, insight, and long-term stability. Treatment is collaborative and often integrated with psychiatric care to support overall functioning and wellness.
14 Years Experience
Online in Lebanon, OR
Bipolar
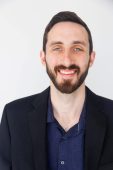
Dr. Michael Marossy
Psychologist, Ph.D.
Living with bipolar disorder can feel confusing, destabilizing, and emotionally exhausting both for individuals and for the people who care about them. Mood instability often affects relationships, identity, work functioning, self-esteem, and overall quality of life. Many clients also struggle with anxiety, shame, impulsivity, depression, or difficulty understanding patterns in their emotional experience.
I provide therapy for individuals living with bipolar spectrum conditions with a focus on emotional regulation, insight, stability, coping skills, relational functioning, and long-term psychological wellbeing. My approach emphasizes collaboration, psychoeducation, and evidence-based treatment while also recognizing the importance of understanding each person’s unique personality, life history, and emotional experience beyond diagnostic labels alone.
8 Years Experience
Online in Lebanon, OR
Bipolar
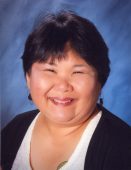
Malama Counseling, LLC
Licensed Professional Counselor, MA, LPC
Bipolar Disorder is a mental health condition characterized by extreme, alternating shifts in mood, energy, and activity levels. It causes significant disruptions to daily functioning and is, for many, a lifelong condition requiring management through medication and therapy. I use the Pomodoro Technique of time management during manic episodes.
10 Years Experience
Online in Lebanon, OR
Bipolar Disorder therapists in Lebanon, OR Statistics
Bipolar Disorder therapists in Lebanon, OR average 13 years of experience and charge around $191 per session. 100% offer online sessions. The top treatment approaches are Cognitive Behavioral Therapy (CBT) (64%), Dialectical Behavior Therapy (DBT) (50%), and Behavioral Therapy (43%).
Average years in practice
13 Years Experience
Average cost per session
$191
Accept insurance
50%
Offer sliding scale
64%
Gender ID
| 45% |
Female |
|
| 44% |
Male |
|
| 11% |
Non-Binary |
|
Session Type
| 50% |
In Person and Online |
|
| 50% |
Online Only |
|
Top Treatment Approaches
| 64% | Cognitive Behavioral Therapy (CBT) |
| 50% | Dialectical Behavior Therapy (DBT) |
| 43% | Behavioral Therapy |
| 43% | Internal Family Systems (IFS) |
| 43% | Person-Centered Therapy (Rogerian) |
| 36% | Acceptance & Commitment Therapy (ACT) |
| 36% | Emotionally Focused Therapy (EFT) |
Ages Served
| 93% | Adult |
| 71% | Senior |
| 57% | Young Adult |
| 50% | Teen |
| 14% | Children |
Client Focus
| 57% | LGBTQ+ |
| 50% | Men |
| 43% | Black / African American |
| 43% | Buddhist |
| 43% | Persons with Disabilities |