LGBTQ+ Issues therapists in North Logan, UT
Browse LGBTQ+ Issues therapists in North Logan, Utah. Compare credentials, specialties and therapeutic approach. Contact a therapist to learn more.

LGBTQ+
Dr. Michael M. Grant
Psychologist, Licensed Clinical Psychologist PhD, MBA
As a gay man myself, I am intimately familiar with the struggle, the misunderstanding, the judgments, and the challenges of living as a member of the LGBTQA community. Support is essential and I can provide that to you.
24 Years Experience
Online in North Logan, UT
LGBTQ+
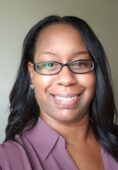
Dr. Aretha Steele (Mindful Healing Counseling)
Psychologist, PsyD
Hey! If you're navigating the unique challenges that come with being a part of the queer and LGBTQ+ community, we're here to offer a supportive space just for you. As a specialist, we understand the importance of embracing your identity and the hurdles that might come your way. Let's work together to explore your thoughts, feelings, and experiences in a judgment-free zone. Whether it's coming out, building self-acceptance, or facing societal pressures, we're here to help. Your journey matters, and we're dedicated to providing a safe space where you can be your authentic self. Let's team up to make your path one of self-discovery, empowerment, and pride. You're not alone, and we're honored to be part of your journey.
(Note: We have specific therapists who specialize in this area at our practice. See our website for more information)
17 Years Experience
Online in North Logan, UT (Online Only)
LGBTQ+
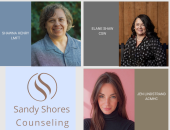
Sandy Shores Counseling
Marriage and Family Therapist, LMFT, ACMHC, CSW, LCSW
We offer affirmative therapy for individuals from BIPOC and LGBTQIA+ communities, addressing unique challenges and barriers to treatment with culturally competent therapists. Feeling isolated or lonely as an LGBTQ+ person can be especially painful, particularly in spaces where you don’t feel fully seen or accepted. In therapy, we’ll create a safe, affirming space to explore these feelings and work toward building authentic connections and a deeper sense of belonging.
14 Years Experience
Online in North Logan, UT
LGBTQ+
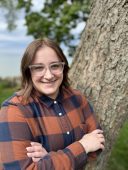
Lauren Whitlow
Psychologist, PsyD
I provide an affirming, inclusive space for LGBTQ+ individuals to explore their experiences with authenticity and without judgment. Whether you're navigating questions about identity, coming out, relationships, family dynamics, discrimination, or simply looking for a therapist who understands the importance of affirming care, therapy can offer meaningful support. T
1 Years Experience
Online in North Logan, UT (Online Only)

LGBTQ+
Mackson Psychology
Psychologist, Samantha Mackson, Psy.D.
Navigating identity, relationships, family dynamics, and societal expectations can bring unique challenges for LGBTQ+ individuals. I provide a supportive, affirming space to explore these experiences, build self-acceptance, and work through anxiety, relationship concerns, and other challenges that may arise.
6 Years Experience
Online in North Logan, UT (Online Only)
LGBTQ+ Issues therapists in North Logan, UT Statistics
LGBTQ+ Issues therapists in North Logan, UT average 15 years of experience and charge around $208 per session. 100% offer online sessions. The top treatment approaches are Cognitive Behavioral Therapy (CBT) (72%), Acceptance & Commitment Therapy (ACT) (41%), and Psychodynamic Therapy (38%).
Average years in practice
15 Years Experience
Average cost per session
$208
Accept insurance
40%
Offer sliding scale
40%
Gender ID
| 59% |
Female |
|
| 34% |
Male |
|
| 5% |
Non-Binary |
|
| 2% |
Gender Fluid |
|
Session Type
| 56% |
In Person and Online |
|
| 44% |
Online Only |
|
Top Treatment Approaches
| 72% | Cognitive Behavioral Therapy (CBT) |
| 41% | Acceptance & Commitment Therapy (ACT) |
| 38% | Psychodynamic Therapy |
| 35% | Existential / Humanistic Therapy |
| 34% | Multicultural Therapy |
| 34% | Person-Centered Therapy (Rogerian) |
| 32% | Dialectical Behavior Therapy (DBT) |
Ages Served
| 99% | Adult |
| 79% | Young Adult |
| 54% | Senior |
| 43% | Teen |
| 21% | Children |
Client Focus
| 84% | LGBTQ+ |
| 63% | Women |
| 54% | Men |
| 33% | Black / African American |
| 33% | Hispanic / Latino |