Native American therapists in Walla Walla, WA
Browse Native American therapists in Walla Walla, Washington. Compare credentials, specialties and therapeutic approach. Contact a therapist to learn more.
Serving Native American
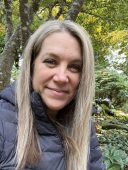
Tara Murphy
Psychologist, Psy.D.
I believe every human being has inherent value, yet so many of us carry deep shame from past experiences that tell us otherwise—messages like “I’m bad,” “I’m too much,” “I’m unlovable,” or “If I show myself, I’ll be rejected.” These beliefs can quietly shape how we see ourselves, our relationships, and what we think is possible. In therapy, I work to help uncover and soften these old burdens so they no longer hold you back. My style is warm, collaborative, and deeply respectful of the courage it takes to show up. Together, we’ll build a space where you can feel seen in your wholeness, reconnect with your own inner wisdom, and move toward a life that feels freer and more grounded.
29 Years Experience
Online in Walla Walla, WA (Online Only)

Serving Native American
Tiffany Cason
Psychiatric Nurse Practitioner, PMHNP-BC
If you are struggling with ADHD, anxiety, depression, PTSD, bipolar disorder, insomnia, or other mental health challenges, I am here for you. I have more than 6 years of medical experience. I have specialized training in psychiatric mental health, and I have worked in crisis stabilization and outpatient behavioral health settings, supporting individuals with diverse mental health needs.
1 Years Experience
Online in Walla Walla, WA (Online Only)

Serving Native American
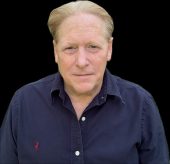
Larry Nussbaum, LIFE JOURNEY CENTEER
Licensed Clinical Social Worker, MSW, LSCSW, LISCW
Everyone at times needs some support or coaching on their life journey. I'd be happy to sit down with you or talk on the phone and compassionately listen to your story and lend some hope and encouragement. I view "problems" as opportunities to work on and overcome the 'threats' within and around us and to open up our lives to new levels of growth.
46 Years Experience
Online in Walla Walla, WA
Serving Native American
Brian McCormack (Connemara Counseling)
Counselor/Therapist, LPC-A/LMHCA
My counseling philosophy is simple yet profound: to build a genuine therapeutic relationship where you feel understood, supported, and empowered. I am committed to equipping you with the tools and strategies to navigate life’s challenges and create lasting change and renewed purpose."
2 Years Experience
Online in Walla Walla, WA (Online Only)
Serving Native American
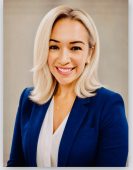
Roxanne Luna
Psychiatric Nurse Practitioner, PMHNP-BC
ADHD Testing and treatment available: New patients seen the same week. Are you struggling with ADHD, anxiety, depression, PTSD, bipolar disorder, insomnia, or other mental health challenges? You do not have to face them alone. I have over 8 years of medical experience caring for adolescents and adults across a variety of mental health settings. I am a board-certified Psychiatric mental health nurse practitioner and I see patients ages 10-65.
1 Years Experience
Online in Walla Walla, WA (Online Only)
Native American therapists in Walla Walla, WA Statistics
Native American therapists in Walla Walla, WA average 14 years of experience and charge around $210 per session. 100% offer online sessions. The most commonly treated issues are Anxiety or Fears (85%), Depression (77%), and Loss or Grief (70%).
Average years in practice
14 Years Experience
Average cost per session
$210
Accept insurance
32%
Offer sliding scale
55%
Gender ID
| 61% |
Female |
|
| 31% |
Male |
|
| 4% |
Gender Fluid |
|
| 4% |
Non-Binary |
|
Session Type
| 68% |
Online Only |
|
| 32% |
In Person and Online |
|
Top Specialties
| 85% | Anxiety or Fears |
| 77% | Depression |
| 70% | Loss or Grief |
| 64% | Trauma and PTSD |
| 62% | Stress |
| 60% | Self Esteem |
| 51% | ADHD |
Ages Served
| 100% | Adult |
| 89% | Young Adult |
| 70% | Senior |
| 45% | Teen |
| 17% | Children |
Client Focus
| 100% | Native American |
| 91% | Women |
| 83% | Hispanic / Latino |
| 81% | LGBTQ+ |
| 79% | Black / African American |