Therapists in Atmore, AL
Browse therapists in Atmore, Alabama. Compare credentials, specialties and therapeutic approach. Contact a therapist to learn more.
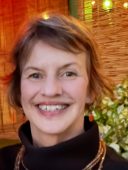
Dorothy Brown
Psychologist, Ph.D.
I am a Psychologist and a certified yoga teacher. I take a wholistic approach to therapy with a slightly spiritual bent. I believe in the mind-body connection and encourage mindfulness and meditation if clients feel comfortable with it. I work with people to change their unhealthy thoughts and to relax their body.
36 Years Experience
Online in Atmore, AL
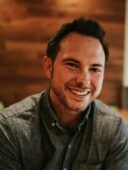
Dr. Mike Strand
Psychologist, PsyD
Hey there! I’m Mike Strand, an experienced psychologist with over 15 years of dedication to guiding individuals on their journey of self-improvement. My expertise lies in helping clients overcome emotional challenges to enhance personal growth and strengthen relationships. I recognize that seeking support can be difficult, which is why I will strive to make therapy as welcoming and approachable as possible. Our sessions are collaborative, tailored to your specific needs, facilitating deep and lasting transformation.
18 Years Experience
Online in Atmore, AL
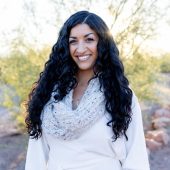
Dr. Amanda Malak
Psychologist, Clinical Psychologist
I believe people can build the lives they want to live by aligning themselves with their values, which may shift with the various seasons of life.
12 Years Experience
Online in Atmore, AL
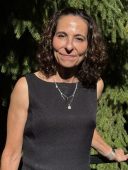
Dr. Madelyn Satz
Psychologist, Ph.D.
Life is challenging. All of us will deal with difficulty at some point in our lives, and many of us will face repeated struggles. We have a hand in some of these troubles and others we have no control over. But we always have control over how we interpret events, how we relate to them, how we make sense of them, and what we do as a result. There is validity in whatever way we view our situation, but as a starting place, not the only place, and we can move through and beyond into a clearing of many more and better possibilities.
I have many tools and techniques and strategies to shift perspective from deeply painful to healing and expansion. Despite how vulnerable we are in life, there is also a great deal of thriving that is available to us - when we know how to harness it.
37 Years Experience
Online in Atmore, AL

Rising Phoenix Therapy - Dempsey Young, Psy.D.
Psychologist, Licensed Psychologist
Dr. Dempsey is a licensed psychologist that provides individual and couples therapy services as well as psychological testing for adults to help people thrive and begin living a fulfilling life as the best versions of themselves. I am not really a sit back and just listen therapist... as I ask you to bring your authentic self to sessions, I do the same and often a lot more interpersonal and direct if needed but of course invested in our relationship as a safe and empathic one. Sometimes being stuck in the trees blocks us from moving forward and to where we want to be. Through therapy, we can work our way through the woods together to the open field waiting for you. You DESERVE to be your best and full self and I believe I can help bring that to your life. Reach out and we can chat about your concerns and get started!
12 Years Experience
Online in Atmore, AL (Online Only)
Atmore, AL therapists Statistics
Therapists in Atmore, AL average 16 years of experience and charge around $210 per session. 100% offer online sessions. The most commonly treated issues are Anxiety or Fears (81%), Depression (67%), and Stress (54%).
Average years in practice
16 Years Experience
Average cost per session
$210
Accept insurance
39%
Offer sliding scale
29%
Gender ID
| 65% |
Female |
|
| 32% |
Male |
|
| 2% |
Non-Binary |
|
| 1% |
Gender Fluid |
|
Session Type
| 54% |
In Person and Online |
|
| 46% |
Online Only |
|
Top Specialties
| 81% | Anxiety or Fears |
| 67% | Depression |
| 54% | Stress |
| 51% | Trauma and PTSD |
| 44% | Loss or Grief |
| 44% | Self Esteem |
| 39% | Social Anxiety |
Ages Served
| 98% | Adult |
| 69% | Young Adult |
| 48% | Senior |
| 37% | Teen |
| 15% | Children |
Client Focus
| 50% | Women |
| 34% | LGBTQ+ |
| 34% | Men |
| 23% | Military / Veterans |
| 19% | Black / African American |