LGBTQ+ therapists in Fort Mitchell, AL
Browse LGBTQ+ therapists in Fort Mitchell, Alabama. Compare credentials, specialties and therapeutic approach. Contact a therapist to learn more.
View nearby cities
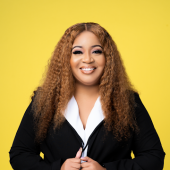
Serving LGBTQ+
Fallon Reynolds
Licensed Professional Counselor, EdS, LPC
What makes my practice stand out is my dedication to practical, skill-building care. I specialize in evidence-based modalities like CBT and DBT, which offer you concrete tools to identify thought patterns, regulate emotions, and foster lasting growth. My goal is to help you move beyond just 'talking' about your challenges to actively cultivating the balance and clarity you deserve. I invite you to reach out for a consultation—let’s start working together to help you bloom."
11 Years Experience
Online in Fort Mitchell, AL (Online Only)

Serving LGBTQ+
Dr. Ashley Gulden
Psychologist, Licensed Psychologist
Dr. Ashley Gulden is a dedicated licensed psychologist specializing in mental health support for parents and caregivers. She understands the unique emotional challenges that come with raising children, maintaining healthy relationships, balancing careers, and navigating major life transitions. She also offers career counseling and assessment packages.
13 Years Experience
Online in Fort Mitchell, AL
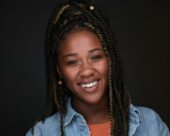
Serving LGBTQ+
Stephanie Davis
Hypnotherapist, Cht
Your mind and body are deeply connected—and lasting change begins within. Hypnosis helps reprogram the subconscious mind, easing stress, releasing emotional blocks, and strengthening the mind-body connection. Research shows hypnosis can lower cortisol (the stress hormone) and support overall well-being. Every session is more than relaxation—it's an opportunity to heal, grow, and reconnect with your best self.
4 Years Experience
Online in Fort Mitchell, AL (Online Only)

Serving LGBTQ+
Benjamin Counseling and Consulting, LLC
Licensed Professional Counselor, MA, LPC-S, PMH-C
I am a Licensed Professional Counselor Supervisor and owner of Benjamin Counseling and Consulting, LLC. At Benjamin Counseling, we offer individual and relationship counseling services for individuals 15 years of age and above, throughout the state of Alabama. Both in office and Telehealth slots are available. Your experience with Benjamin Counseling will include the following tenets:
-Safe, comfortable, and confidential environment
-Respect and support
-Compassionate, nonjudgmental listening
-Person centered goal setting
-Active movement towards goals identified
-Useful interventions for application in daily living
-Warm and welcoming, yet focused and challenging environment
-Accessibility
-Professionalism
-Integration of evidence-based practices
16 Years Experience
Online in Fort Mitchell, AL
Serving LGBTQ+
Forest Williams
Life Coach, ICF
If you are spiritual, but not religious and need relationship support, you've come to the right place. Relationship Coaching helps you make tangible changes in your day to day relationship dynamic so you're not getting stuck on the same triggers and repeating the same patterns. This isn't about processing in circles endlessly, but implementing tangible change so you can heal, grow and deepen intimacy. Schedule a free curiosity call.
7 Years Experience
Online in Fort Mitchell, AL (Online Only)
LGBTQ+ therapists in Fort Mitchell, AL Statistics
LGBTQ+ therapists in Fort Mitchell, AL average 14 years of experience and charge around $213 per session. 100% offer online sessions. The most commonly treated issues are Anxiety or Fears (81%), Depression (66%), and Stress (59%).
Average years in practice
14 Years Experience
Average cost per session
$213
Accept insurance
36%
Offer sliding scale
41%
Gender ID
| 66% |
Female |
|
| 26% |
Male |
|
| 5% |
Non-Binary |
|
| 3% |
Gender Fluid |
|
Session Type
| 54% |
In Person and Online |
|
| 46% |
Online Only |
|
Top Specialties
| 81% | Anxiety or Fears |
| 66% | Depression |
| 59% | Stress |
| 59% | Trauma and PTSD |
| 54% | LGBTQ+ Issues |
| 53% | Loss or Grief |
| 49% | Self Esteem |
Ages Served
| 99% | Adult |
| 80% | Young Adult |
| 54% | Senior |
| 36% | Teen |
| 16% | Children |
Client Focus
| 100% | LGBTQ+ |
| 86% | Women |
| 60% | Men |
| 44% | Black / African American |
| 41% | Military / Veterans |