Somatic therapists in Selma, AL
Browse Somatic therapists in Selma, Alabama. Compare credentials, specialties and therapeutic approach. Contact a therapist to learn more.
View nearby cities
Somatic
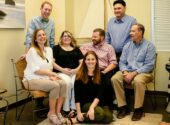
Collins Counseling Associates
Licensed Professional Counselor, LPC, LMFT
For an appointment call (251) 473-3410.
Twelve licensed counselors, with offices in Mobile, Fairhope and Atmore, provide specialized treatment for individuals and families impacted by life problems, relationship stress, mental health issues, substance abuse problems, and abuse. We strive to help people in a safe, private, non-judgmental place to work through issues & ultimately find some peace and happiness in life. Our group includes experts in fields of sex therapy, grief counseling, addiction problems and LGBTQ needs.
21 Years Experience
Online in Selma, AL
Somatic
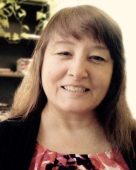
Denise Bike
Psychologist, PhD
Are you driven, creative, and self-aware — but inside, you feel anxious or on edge? You know the skills and how to do the “right things” to cope, yet the anxiety's still there. What if it's embedded in your body, placing you on constant alert to try and stay safe? Through a somatic parts work or Constellations intensive, we can partner with your nervous system. Inviting new ways to release old patterns of fear, fawn, and freeze. You can learn to create an inner sense of safety that embodies true calm, presence, and connection.
13 Years Experience
Online in Selma, AL (Online Only)
Somatic
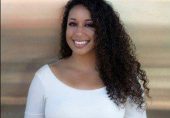
Amber McKinney-Morgan
Licensed Clinical Social Worker, LCSW, LICSW
Amber provides therapy with a holistic and eclectic approach that is individualized, taking into account that the client is the expert of what they need and how they best retain information. The therapeutic process can incorporate interventions related, but not limited to, Eye Movement desensitization and Reprocessing (EMDR), internal family systems (IFS), Somatic Experiencing (SE), Sex Therapy, Hypnosis, CBT-E, EFT, Bowen, Gottman and more.
8 Years Experience
Online in Selma, AL (Online Only)

Somatic
Renee Woodall
Psychologist, Ph.D.
I provide therapy for individuals and couples in midlife or retirement—helping you move through life’s changes with clarity, purpose, and hope. You’ve worked hard and cared for others, yet lately something feels off. Whether you’re feeling burned out, overwhelmed by life’s demands, or unsure about what comes next, therapy offers a space to slow down, heal, grow, and begin creating a life that feels more grounded, fulfilling, and enjoyable again.
27 Years Experience
Online in Selma, AL

Somatic
Paigean Jones
Licensed Clinical Social Worker, PhD, LCSW, PMH-C, RYT-200
In a world that often values toughness, being a highly sensitive and soft-hearted person can feel like a burden. We might say “yes” when we really mean “no”. And we may feel like we have to act differently to fit in, even if it means putting others before ourselves. Sometimes it can feel tough to find our inner courage, speak up for what we want, and create positive boundaries. This can be especially true when we’re striving for success in our careers, supporting our loved ones emotionally, or navigating big life changes like pregnancy and the postpartum period.
7 Years Experience
Online in Selma, AL
Somatic Therapy therapists in Selma, AL Statistics
Somatic Therapy therapists in Selma, AL average 15 years of experience and charge around $198 per session. 100% offer online sessions. The most commonly treated issues are Anxiety or Fears (84%), Stress (73%), and Trauma and PTSD (71%).
Average years in practice
15 Years Experience
Average cost per session
$198
Accept insurance
33%
Offer sliding scale
47%
Gender ID
| 75% |
Female |
|
| 19% |
Male |
|
| 4% |
Gender Fluid |
|
| 2% |
Non-Binary |
|
Session Type
| 58% |
In Person and Online |
|
| 42% |
Online Only |
|
Top Specialties
| 84% | Anxiety or Fears |
| 73% | Stress |
| 71% | Trauma and PTSD |
| 69% | Self Esteem |
| 60% | Depression |
| 60% | Loss or Grief |
| 56% | Women's Issues |
Ages Served
| 100% | Adult |
| 64% | Young Adult |
| 51% | Senior |
| 27% | Teen |
| 16% | Children |
Client Focus
| 64% | Women |
| 51% | LGBTQ+ |
| 40% | Men |
| 29% | Military / Veterans |
| 24% | Black / African American |