LGBTQ+ Issues therapists in Casa Grande, AZ
Browse LGBTQ+ Issues therapists in Casa Grande, Arizona. Compare credentials, specialties and therapeutic approach. Contact a therapist to learn more.
LGBTQ+
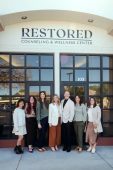
Restored Counseling & Wellness Center, PLLC
Marriage and Family Therapist, LMFT, LPC, NMD
At Restored, every client is welcome exactly as they are. Our therapists provide affirming, culturally sensitive care for LGBTQ+ individuals and couples navigating identity, relationships, family dynamics, minority stress, trauma, and more. We understand that the experiences of LGBTQ+ clients are shaped by unique social and relational contexts — and our team shows up with the awareness, humility, and genuine care those experiences deserve.
14 Years Experience
In-Person Near Casa Grande, AZ
Online in Casa Grande, AZ
LGBTQ+
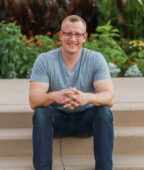
Michael Klinkner
Licensed Clinical Social Worker, LCSW
LGBT related issues are so complex and individual. They require lots of special training and a holistic approach. I have years of training and experience in working with this issue. I work to help clients address their issues from a variety of different angles and determine the underlying causes behind the problems.
27 Years Experience
In-Person Near Casa Grande, AZ
Online in Casa Grande, AZ

LGBTQ+
Kelsi McMartin
Marriage and Family Therapist, MA, LMFT
I am a bisexual woman and have training in working with the LBGTQIA community around issues related to identity, sexuality, polyamory, and couples work.
24 Years Experience
Online in Casa Grande, AZ (Online Only)

LGBTQ+
Michaela Decker
Counselor/Therapist, LMFT
As a counselor, it is my passion to create supportive, grounded and non-judgmental therapeutic relationships. My goal in therapy is to encourage insight and connection. I have a wide range of experience working with diverse individuals and I value inclusivity of all gender identities, sexual orientations, cultural backgrounds and life experiences. It is my hope to stand next to you as you navigate your unique life transitions. Whether you are seeking to gain a better understanding of your personal journey or are hoping to tackle specific obstacles, I would be honored to help you navigate your personal growth and development.
16 Years Experience
Online in Casa Grande, AZ

LGBTQ+
Kate Winderman
Psychologist, Ph.D., LP
Working with members of the queer community has always been at the heart of what I do as a therapist. I have over a decade of experience of working with members of the queer community in therapy, and have helped folks through all sorts of issues that impact our community in unique ways (e.g., coming out, coming in to oneself, family issues, religious trauma, minority stress and discrimination, internalized homophobia, intersection of other marginalized identities, and more). My goal is to provide a safe and affirming space for sexual and gender minorities to feel free to be their most authentic selves in the therapy room.
13 Years Experience
Online in Casa Grande, AZ
LGBTQ+ Issues therapists in Casa Grande, AZ Statistics
LGBTQ+ Issues therapists in Casa Grande, AZ average 15 years of experience and charge around $207 per session. 100% offer online sessions. The top treatment approaches are Cognitive Behavioral Therapy (CBT) (71%), Acceptance & Commitment Therapy (ACT) (41%), and Psychodynamic Therapy (41%).
Average years in practice
15 Years Experience
Average cost per session
$207
Accept insurance
38%
Offer sliding scale
33%
Gender ID
| 58% |
Female |
|
| 32% |
Male |
|
| 7% |
Non-Binary |
|
| 3% |
Gender Fluid |
|
Session Type
| 54% |
In Person and Online |
|
| 46% |
Online Only |
|
Top Treatment Approaches
| 71% | Cognitive Behavioral Therapy (CBT) |
| 41% | Acceptance & Commitment Therapy (ACT) |
| 41% | Psychodynamic Therapy |
| 34% | Existential / Humanistic Therapy |
| 32% | Person-Centered Therapy (Rogerian) |
| 32% | Multicultural Therapy |
| 30% | Dialectical Behavior Therapy (DBT) |
Ages Served
| 99% | Adult |
| 79% | Young Adult |
| 51% | Senior |
| 40% | Teen |
| 21% | Children |
Client Focus
| 81% | LGBTQ+ |
| 62% | Women |
| 50% | Men |
| 35% | Hispanic / Latino |
| 32% | Black / African American |