Psychodynamic therapists in Casa Grande, AZ
Browse Psychodynamic therapists in Casa Grande, Arizona. Compare credentials, specialties and therapeutic approach. Contact a therapist to learn more.
Psychodynamic
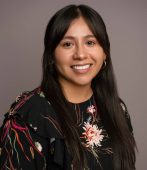
Dr. Indra Gonzalez
Psychologist, PsyD
I am a bilingual psychologist specializing in trauma recovery therapy across the lifespan. I am also a certified in EMDR therapist. I prioritize establishing a safe and genuine therapeutic relationship with each patient. I strive to create a space where they can feel seen, safe, and empowered. I take a collaborative and compassionate stance with patients. Within our work together, we will highlight diversity and cultural factors, personal values, resiliency, and strengths. I integrate trauma-informed and culturally responsive approaches alongside evidence-based modalities to address trauma, anxiety, depression, self-esteem, behavioral and identity development concerns .
9 Years Experience
Online in Casa Grande, AZ (Online Only)

Psychodynamic
Christine Sparacino
Psychologist, PsyD
Hi! I'm Dr. Christine Sparacino. I have been working in the mental health field for more than 20 years. I work with highly sensitive and empathic individuals, people navigating loss and life transitions, those feeling with grief and chronic illness and autoimmune disease. Since 2015 I have also worked as a diabetes psychologist, supporting patients with their health.
My main focus is to help individuals navigate difficult seasons and transitions in their lives, such as adjusting to a recent loss or change in health status. My main areas of expertise are: grief and loss, chronic illness and autoimmune disease, and working with Highly Sensitive People and empaths.
23 Years Experience
Online in Casa Grande, AZ (Online Only)

Psychodynamic
Caitlin Derouen
Licensed Professional Counselor, NCC, LPC, EMDRT
Hi, I'm Caitlin! I am a passionate psychotherapist who prioritizes educating and empowering my patients. I believe in helping you to access your natural ability to cope with distress and ultimately heal the roots of your troubling symptoms through holistic therapeutic methods. I utilize highly effective and evidenced based methods such as EMDR and ART, to address these root causes. Treating at the source of our problems is the only way to achieve true change within ourselves. I love being able to be a part of my patient's journey to wellness and watch them achieve their therapeutic goals.
10 Years Experience
In-Person Near Casa Grande, AZ
Online in Casa Grande, AZ
Psychodynamic
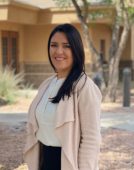
Danielle Bruns
Marriage and Family Therapist, Licensed Marriage and Family Therapist LMFT-16129
I help couples understand where they are stuck and how to achieve the intimacy they long for. I believe you need both practical tools and insight in this process. I believe in creating a unique treatment for the specific needs of each couple.
10 Years Experience
In-Person Near Casa Grande, AZ
Online in Casa Grande, AZ

Psychodynamic
Dr. Jessica Shine
Licensed Professional Counselor, EdD, LPC
Hi, my name is Dr. Jessica Shine! I am caring and passionate about my purpose to help you heal past traumas and navigate through life’s difficult experiences and transitions. I love working with people from all walks of life and growing our therapeutic relationship in a non-judgmental, safe, and supportive environment. I strive to provide you with the necessary tools for your growth and success as your therapist, accountability partner, shoulder to cry on, and cheerleader! I’m here to connect the dots and help you understand how your childhood, family dynamics, intimate relationships, life experiences, and trauma all factor in the life decisions you make.
12 Years Experience
Online in Casa Grande, AZ (Online Only)
Psychodynamic Therapy therapists in Casa Grande, AZ Statistics
Psychodynamic Therapy therapists in Casa Grande, AZ average 17 years of experience and charge around $207 per session. 100% offer online sessions. The most commonly treated issues are Anxiety or Fears (81%), Depression (75%), and Trauma and PTSD (56%).
Average years in practice
17 Years Experience
Average cost per session
$207
Accept insurance
42%
Offer sliding scale
35%
Gender ID
| 64% |
Female |
|
| 31% |
Male |
|
| 4% |
Non-Binary |
|
| 1% |
Gender Fluid |
|
Session Type
| 56% |
In Person and Online |
|
| 44% |
Online Only |
|
Top Specialties
| 81% | Anxiety or Fears |
| 75% | Depression |
| 56% | Trauma and PTSD |
| 54% | Loss or Grief |
| 54% | Self Esteem |
| 54% | Stress |
| 40% | Relationship and Marriage Counseling |
Ages Served
| 98% | Adult |
| 70% | Young Adult |
| 51% | Senior |
| 34% | Teen |
| 18% | Children |
Client Focus
| 51% | Women |
| 40% | LGBTQ+ |
| 31% | Men |
| 26% | Hispanic / Latino |
| 23% | Black / African American |