LGBTQ+ Issues therapists in Nogales, AZ
Browse LGBTQ+ Issues therapists in Nogales, Arizona. Compare credentials, specialties and therapeutic approach. Contact a therapist to learn more.
LGBTQ+
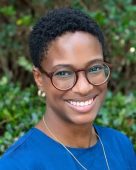
Kourtney Bennett
Psychologist, Ph.D.
I strive to provide an affirming, respectful environment where LGBTQ+ clients can explore identity, relationships, stress, life transitions, and the impact of discrimination or minority stress. Therapy is tailored to your individual experiences and goals—not assumptions about who you are.
9 Years Experience
Online in Nogales, AZ

LGBTQ+
Dr. Katy Crone
Psychologist, Psy.D., LCP
Members of marginalized groups face a range of stress, from inequality to threats to safety. Experiences often accumulate and create frustration, tension, or hopelessness. Therapy provides empowerment for you to develop long-lasting self-acceptance and resilience. We are committed to the support and celebration of all identities including LGBTQ+ community members.
15 Years Experience
Online in Nogales, AZ (Online Only)

LGBTQ+
Dr. Max Hurley-Dorof
Psychologist, Psy.D.
I specialize in working with folks with many different identities. This includes but certainly not limited to: gender, sexuality, race, cultural, kink, etc. I work from an intersectional and systems approach; meaning working towards understanding how all of our identities relate to one another, and how they operate under the systems in which we live.
8 Years Experience
Online in Nogales, AZ (Online Only)
LGBTQ+
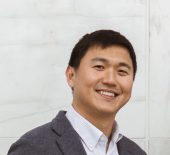
Dr. Jason Wang, Inflection Points Therapy
Psychologist, PhD
Some LGBTQ+ clients come to therapy with concerns directly connected to their identities and experiences, while others want to address broader areas of their lives with a therapist to whom they don't need to explain their identity.
With LGBTQ+ clients, it can often be important to recognize the effects of stigma, discrimination, rejection, and social or political uncertainty while also recognizing sources of strength, including resilience, authenticity, pride, chosen family, friendship, and community.
8 Years Experience
Online in Nogales, AZ
LGBTQ+
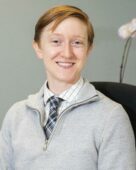
Dr. Caroline Hicks
Psychologist, PhD, LP
Sexual orientation and gender identity development are my areas of focus, and we use this space to make sure all intersecting identities (e.g., racial, religious, political, national) are considered as you find your authentic path in the world. This space is one where we can focus on your sexual orientation and/or gender identity development, or use these identities as a source of context to our work. In addition, I work with many trans*, non-binary, gender nonconforming, gender fluid, and other gender expansive folx as they embark on their path of congruence. In addition, I write letters of support for gender affirming surgeries/medical procedures.
9 Years Experience
Online in Nogales, AZ (Online Only)
LGBTQ+ Issues therapists in Nogales, AZ Statistics
LGBTQ+ Issues therapists in Nogales, AZ average 15 years of experience and charge around $207 per session. 100% offer online sessions. The top treatment approaches are Cognitive Behavioral Therapy (CBT) (71%), Acceptance & Commitment Therapy (ACT) (41%), and Psychodynamic Therapy (41%).
Average years in practice
15 Years Experience
Average cost per session
$207
Accept insurance
38%
Offer sliding scale
34%
Gender ID
| 58% |
Female |
|
| 32% |
Male |
|
| 7% |
Non-Binary |
|
| 3% |
Gender Fluid |
|
Session Type
| 55% |
In Person and Online |
|
| 45% |
Online Only |
|
Top Treatment Approaches
| 71% | Cognitive Behavioral Therapy (CBT) |
| 41% | Acceptance & Commitment Therapy (ACT) |
| 41% | Psychodynamic Therapy |
| 35% | Existential / Humanistic Therapy |
| 33% | Person-Centered Therapy (Rogerian) |
| 32% | Multicultural Therapy |
| 30% | Dialectical Behavior Therapy (DBT) |
Ages Served
| 99% | Adult |
| 80% | Young Adult |
| 52% | Senior |
| 40% | Teen |
| 21% | Children |
Client Focus
| 81% | LGBTQ+ |
| 63% | Women |
| 50% | Men |
| 35% | Hispanic / Latino |
| 33% | Black / African American |