Male therapists in Fayetteville, AR
Browse Male therapists in Fayetteville, Arkansas. Compare credentials, specialties and therapeutic approach. Contact a therapist to learn more.
Male
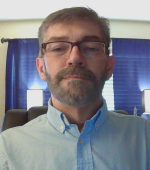
Justin O. Green
Licensed Professional Counselor, LPC
I am a Licensed Professional Counselor and have been in the mental health field for over 30 years, providing therapy for a wide range of mental health issues. I believe in every person's ability to find the best version of themselves and feel this is best achieved with a non-judgmental approach that supports my clients' goals. I utilize established best practice techniques and approach mental health from a secular humanist perspective.
33 Years Experience
Online in Fayetteville, AR (Online Only)
Male
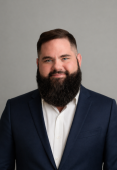
Devon Davasher
Licensed Clinical Social Worker, LCSW, CCM, CFSW, Master ART Practitioner
I became a therapist because I needed one. I lost my mom when I was 18, and in the years that followed I struggled with anxiety and depression and reached for whatever would take the edge off. When I finally sat down with a therapist, it changed my life. Not because it fixed everything right away, but because for the first time I had a space to say the things I had never said out loud. As a gay man, I know what it is like to carry parts of yourself quietly for longer than you should have had to. That lived experience shapes how I show up in the room. Affirming care is not something I do. It is something I live.
13 Years Experience
Online in Fayetteville, AR (Online Only)
Male
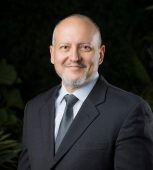
Alexey Tolchinsky
Psychologist, Psy.D.
I apply the principles of affective neuroscience to help high-achieving professionals navigate complex emotional landscapes. As a Clinical Fellow of the Neuropsychoanalysis Association and a researcher, I offer a personalized, comprehensive, and compassionate approach that moves beyond reductive "cookie-cutter" treatments and saccharine AI advice. I focus on deep human connection and clinical accuracy, aiming to help you reach stable results, growth, and emotional freedom. I accept complex cases that other practitioners may find challenging.
I specialize in working with neurodiverse clients from a strength-based, complexity-aware perspective rather than a "disorder" perspective.
11 Years Experience
Online in Fayetteville, AR (Online Only)
Male
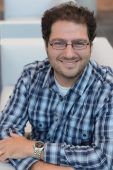
Greg Welikson
Psychologist, PhD
You're a high-achieving professional and a devoted parent —but you feel burned out, perpetually juggling roles, and disconnected from your own life. I help you gain the clarity and structure needed to set authentic boundaries, rediscover your personal identity, and finally manage your complex life with peace and presence.
9 Years Experience
Online in Fayetteville, AR (Online Only)
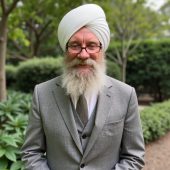
Male
Karambir Khalsa | Khalsa Psychology PLLC
Psychologist, (AZ PSY-005603), Non-Licensed Clinician (CO NLC.0107000)
I create a safe place for you to process your concerns and heal. Sessions are conversational in nature. I want to hear your concerns in your own words and I will reflect back what I am hearing so you can confirm or correct. Our conversations help me to know which techniques are relevant and applicable to your concerns.
3 Years Experience
Online in Fayetteville, AR
Male therapists in Fayetteville, AR Statistics
Male therapists in Fayetteville, AR average 18 years of experience and charge around $218 per session. 100% offer online sessions. The most commonly treated issues are Anxiety or Fears (84%), Depression (68%), and Trauma and PTSD (51%).
Average years in practice
18 Years Experience
Average cost per session
$218
Accept insurance
39%
Offer sliding scale
31%
Gender ID
| 88% |
Male |
|
| 9% |
Female |
|
| 2% |
Non-Binary |
|
| 1% |
Gender Fluid |
|
Session Type
| 58% |
In Person and Online |
|
| 42% |
Online Only |
|
Top Specialties
| 84% | Anxiety or Fears |
| 68% | Depression |
| 51% | Trauma and PTSD |
| 49% | Stress |
| 45% | Social Anxiety |
| 44% | Relationship and Marriage Counseling |
| 44% | Self Esteem |
Ages Served
| 100% | Adult |
| 64% | Young Adult |
| 55% | Senior |
| 38% | Teen |
| 18% | Children |
Client Focus
| 46% | Men |
| 33% | LGBTQ+ |
| 31% | Women |
| 23% | Military / Veterans |
| 17% | Persons with Disabilities |