Eating Disorders therapists in Fort Saint John, BC
Browse Eating Disorders therapists in Fort Saint John, British Columbia, Canada. Compare credentials, specialties and therapeutic approach. Contact a therapist to learn more.
Eating Disorders
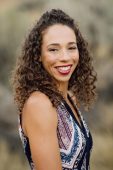
Freedom of Expression Counselling
Licensed Clinical Social Worker, MSW, RCSW, T.S., RPT, CPT
I have supported people with Eating Disorders for the last 9 years. It is very prevalent amongst many populations. I work on the specific presentations of Eating Disorders brought forth and collaboratively design customized strategies to support individuals living their best lives in alignment with their values.
9 Years Experience
Online in Fort Saint John, BC (Online Only)
Eating Disorders
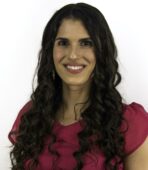
Nina Hopmeier
Licensed Professional Counsellor, Registered Clinical Counsellor (RCC)
Admitting that an eating disorder has developed is a very brave and courageous step. By engaging in this first step you are already beginning your recovery process. Many individuals are in denial about their eating disorder and only acknowledge their problematic behaviours once their health is severely impacted. Since the behaviours of an eating disorder are unique across individuals, the treatment plan too, is unique.
In therapy, we largely explore the meaning that you give to the eating disorder, how you developed your relationship with food, and the purpose that the eating disorder served in your life. Once you gain a deeper understanding of the cause of the eating disorder, my hope is that you view yourself through a nonjudgmental lens, which is a crucial step in the healing process.
In order to help you overcome the eating disorder, I also use a variety of therapy models, such as narrative therapy in order to separate the disorder from the person. Once you perceive the issue as separate from the self, you are more likely to activate your self-healing capacities, which is important for experiencing change and growth. I also use Cognitive Behavioural Therapy for challenging some of the thoughts that you may have about food. Once you gain insight into your personalized history of the eating disorder, as well as the resources that you have for overcoming dysfunctional eating patterns, you move further into your journey to recovery.
15 Years Experience
Online in Fort Saint John, BC (Online Only)
Eating Disorders
Dr. Claire Vines, Psy.D., Psychologist / Licensed /Psychotherapy / Psychoanalytic/
Marriage and Family Therapist, Marriage, Couples, LMFT. Psy.D. Trauma-Focused CBT
An eating disorder can include Anorexia, which is about restricting one's food intake, or self starvation due to fear of gaining weight and self image. Bulimia is eating a large amount of food in a short period of time, often followed by vomiting often using laxatives in order to eliminate the food intake due to fear of getting overweight.
21 Years Experience
Online in Fort Saint John, BC
Eating Disorders
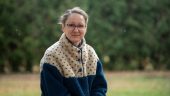
Somatic Healing Arts, Psychotherapy and Wellness
Registered Psychotherapist, RP (qualifying), MA-ExAT
Eating disorders affect both the mind and the body, often creating tension, disconnection, and a complicated relationship with food and self-image. Approaches like art therapy and sensorimotor therapy engage both body and mind, helping individuals safely explore emotions, reconnect with bodily sensations, and develop a more compassionate, balanced, and grounded relationship with themselves and their bodies.
9 Years Experience
Online in Fort Saint John, BC
Eating Disorders
Nicklas Ehrlich
Counsellor/Therapist, MSW, RCC (#0843), RSW (#11561), Psychotherapist, Counsellor, Life-Coach, Hypnotherapist, Advanced Neurofeedback Trainer
Eating disorders can come from a core non-secure attachment when young, anxiety, insecurity, depression, perfectionism, lack of self love and accepting self, trauma, environmental conditioning, interruption and being stuck in a younger developmental stage and unable to complete/move up the stages.
46 Years Experience
Online in Fort Saint John, BC
Eating Disorders therapists in Fort Saint John, BC Statistics
Eating Disorders therapists in Fort Saint John, BC average 13 years of experience and charge around $156 per session. 100% offer online sessions. The top treatment approaches are Cognitive Behavioral Therapy (CBT) (73%), Emotionally Focused Therapy (EFT) (65%), and Dialectical Behavior Therapy (DBT) (58%).
Average years in practice
13 Years Experience
Average cost per session
$156
Accept insurance
68%
Offer sliding scale
55%
Gender ID
| 74% |
Female |
|
| 22% |
Male |
|
| 2% |
Gender Fluid |
|
| 2% |
Non-Binary |
|
Session Type
| 62% |
In Person and Online |
|
| 38% |
Online Only |
|
Top Treatment Approaches
| 73% | Cognitive Behavioral Therapy (CBT) |
| 65% | Emotionally Focused Therapy (EFT) |
| 58% | Dialectical Behavior Therapy (DBT) |
| 58% | Narrative Therapy |
| 58% | Person-Centered Therapy (Rogerian) |
| 55% | Internal Family Systems (IFS) |
| 55% | Somatic Therapy |
Ages Served
| 100% | Adult |
| 80% | Teen |
| 78% | Young Adult |
| 73% | Senior |
| 40% | Children |
Client Focus
| 75% | Women |
| 63% | Men |
| 60% | LGBTQ+ |
| 48% | Persons with Disabilities |
| 40% | Native American |