HIV/AIDS therapists in Valley Springs, CA
Browse HIV/AIDS therapists in Valley Springs, California. Compare credentials, specialties and therapeutic approach. Contact a therapist to learn more.
View nearby cities

HIV/AIDS
Growth and Change Counseling
Marriage and Family Therapist, LMFT
HIV/AIDS was stigmatized for a long time and seen by many as a death sentence. Our understanding of the disease has evolved and its important for those dealing with this issue to understand that while you may have to adjust to your experiences, life is still filled with hope, life still can be good, and you still can have dreams. Whatever your struggles around this issue, we at Growth and Change Counseling want you to know that we are here for you.
8 Years Experience
Online in Valley Springs, CA (Online Only)
HIV/AIDS
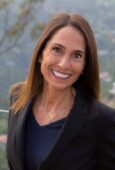
Julie Anderson
Psychologist, Ph.D.
Having worked at the American Foundation for AIDS Research, the L.A. LGBT Center, and GLAAD, I bring those experiences from the HIV/AIDS epidemic to my work with those affected by HIV/AIDS.
26 Years Experience
Online in Valley Springs, CA
HIV/AIDS
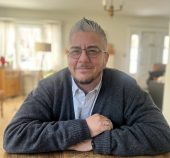
Wyatt Okeefe
Licensed Mental Health Counselor, MA, LMHC, LPC, LPCC
I provide supportive, affirming therapy for individuals navigating the emotional and psychological challenges associated with HIV/AIDS. Treatment may address anxiety, depression, stigma, disclosure, relationship concerns, changes in self-image, adjustment to diagnosis, and coping with uncertainty or life transitions. Therapy offers a confidential space to process difficult emotions, strengthen coping skills, and support resilience and overall well-being.
28 Years Experience
Online in Valley Springs, CA (Online Only)
HIV/AIDS
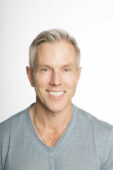
David Strah
Marriage and Family Therapist, MA, LMFT
I have worked with several HIV+ clients
Online in Valley Springs, CA

HIV/AIDS
Phillip McCulley
Marriage and Family Therapist, MA, LMFT, CSAT
I provide supportive and affirming therapy for individuals and couples impacted by HIV or AIDS. I am deeply aware of the fear, loss, and stigma that emerged during the AIDS crisis of the 1980s and 1990s, and how those experiences continue to shape the lives, relationships, and mental health of many people today. For some, this includes grief, trauma, survivor’s guilt, or long standing anxiety related to health, intimacy, or trust.
My work is grounded in respect, empathy, and an understanding of the unique challenges faced by the LGBTQ community. I offer a space where you can speak openly about your experiences without having to explain or defend them. This may include support around disclosure, dating and relationships, sexuality and intimacy, medical stress, or navigating changes in identity and community over time.
Whether you are newly diagnosed, have been living with HIV for many years, or are supporting a partner or loved one, therapy can be a place to process emotions, strengthen relationships, and reconnect with a sense of stability and meaning. My goal is to support you in living fully and authentically while honoring both your history and your resilience.
22 Years Experience
Online in Valley Springs, CA
HIV/AIDS therapists in Valley Springs, CA Statistics
HIV/AIDS therapists in Valley Springs, CA average 18 years of experience and charge around $240 per session. 100% offer online sessions. The top treatment approaches are Cognitive Behavioral Therapy (CBT) (68%), Behavioral Therapy (42%), and Existential / Humanistic Therapy (42%).
Average years in practice
18 Years Experience
Average cost per session
$240
Accept insurance
26%
Offer sliding scale
37%
Gender ID
| 57% |
Male |
|
| 30% |
Female |
|
| 9% |
Non-Binary |
|
| 4% |
Gender Fluid |
|
Session Type
| 74% |
In Person and Online |
|
| 26% |
Online Only |
|
Top Treatment Approaches
| 68% | Cognitive Behavioral Therapy (CBT) |
| 42% | Behavioral Therapy |
| 42% | Existential / Humanistic Therapy |
| 42% | Person-Centered Therapy (Rogerian) |
| 42% | Psychodynamic Therapy |
| 42% | Relational Psychotherapy |
| 42% | Solution-Focused Brief Therapy (SFBT) |
Ages Served
| 100% | Adult |
| 84% | Senior |
| 47% | Young Adult |
| 37% | Teen |
| 26% | Children |
Client Focus
| 84% | LGBTQ+ |
| 53% | Men |
| 53% | Women |
| 42% | Asian |
| 42% | Persons with Disabilities |