Native American therapists in Norwalk, CT
Browse Native American therapists in Norwalk, Connecticut. Compare credentials, specialties and therapeutic approach. Contact a therapist to learn more.

Serving Native American
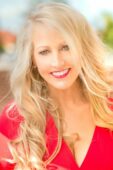
Samantha Allison-Evans, M.A., LPC
Licensed Mental Health Counselor, M.A., LPC
"At Allison Evans Counseling & Consulting, PLLC , our mission is to heal, empower, and transform lives through compassionate counseling services. We strive to empower individuals to reach their full potential and make positive changes in their lives. Our ultimate goal is to help clients achieve personal growth, overcome challenges, and find lasting happiness and fulfillment."
11 Years Experience
Online in Norwalk, CT (Online Only)
Serving Native American
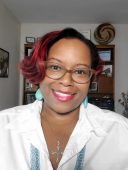
Susan Spicer
Psychologist, PhD
I specialize in EMDR therapy to help individuals heal from trauma and narcissistic abuse, and to return to a place of self-love and emotional balance. Experiences of childhood physical, emotional or sexual abuse can remain stuck in the body, as can instances of narcissistic abuse. These have the potential to contribute to symptoms of depression, anxiety, and hypervigilance as well as problems successfully navigating relationships and managing daily living. I utilize EMDR therapy to change the way these negative memories are stored in the brain, and help you achieve a place of resolution and peace. As a neuropsychologist, I can help you condition your thoughts and rewire your brain for happiness and success.
26 Years Experience
Online in Norwalk, CT (Online Only)
Serving Native American
Kate E. Stephenson
Life Coach, ICF Professional Certified Coach (PCC), Holistic Life, Career & Executive
Have you made time and space for you today? Most of us haven't—and therapy isn't the only way to do it. Consider Holistic Life Coaching instead. As a certified professional coach, I am here to encourage you to take a breath, take a beat to consider who you are, where you are, and if you are feeling satisfaction in your own success. If you aren't, I invite you to have a conversation with yourself about what can be done differently—allow me to moderate that conversation. Together we can help you live into your own definition of success and begin to feel it deeply. To breathe it in and live.
7 Years Experience
Online in Norwalk, CT (Online Only)

Serving Native American
Total Wellness Center
Treatment Center, We have LCSWs and LPCs providing various talk therapies. It's key to find a provider who fits your unique needs.
At Total Wellness Center, we understand that seeking help is a big step. Our compassionate team is dedicated to supporting you on your journey to better mental health. We’re ready to listen and provide personalized care to help you live a healthier, more fulfilling life. Contact us today to schedule your appointment and start your path to wellness!
11 Years Experience
Online in Norwalk, CT
Serving Native American
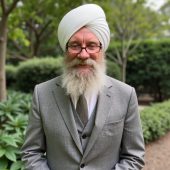
Karambir Khalsa | Khalsa Psychology PLLC
Psychologist, (AZ PSY-005603), Non-Licensed Clinician (CO NLC.0107000)
I create a safe place for you to process your concerns and heal. Sessions are conversational in nature. I want to hear your concerns in your own words and I will reflect back what I am hearing so you can confirm or correct. Our conversations help me to know which techniques are relevant and applicable to your concerns.
3 Years Experience
Online in Norwalk, CT
Native American therapists in Norwalk, CT Statistics
Native American therapists in Norwalk, CT average 17 years of experience and charge around $227 per session. 100% offer online sessions. The most commonly treated issues are Anxiety or Fears (89%), Depression (76%), and Loss or Grief (67%).
Average years in practice
17 Years Experience
Average cost per session
$227
Accept insurance
37%
Offer sliding scale
39%
Gender ID
| 69% |
Female |
|
| 27% |
Male |
|
| 2% |
Gender Fluid |
|
| 2% |
Non-Binary |
|
Session Type
| 54% |
Online Only |
|
| 46% |
In Person and Online |
|
Top Specialties
| 89% | Anxiety or Fears |
| 76% | Depression |
| 67% | Loss or Grief |
| 67% | Trauma and PTSD |
| 61% | Self Esteem |
| 52% | Stress |
| 50% | Women's Issues |
Ages Served
| 100% | Adult |
| 91% | Young Adult |
| 74% | Senior |
| 39% | Teen |
| 15% | Children |
Client Focus
| 100% | Native American |
| 96% | Women |
| 91% | Hispanic / Latino |
| 83% | Black / African American |
| 80% | LGBTQ+ |