Biopsychosocial therapists in Mishawaka, IN
Browse Biopsychosocial therapists in Mishawaka, Indiana. Compare credentials, specialties and therapeutic approach. Contact a therapist to learn more.
View nearby cities

Biopsychosocial
Andrea Barbour
Marriage and Family Therapist, MA, LMFT, PhD(ABD)
The heart of my clinical focus is on meeting you where you are, creating ways to understand and communicate your human experience in ways that feel authentic to you. I have extensive experience in working with long standing emotional distress, this includes complex trauma and mood disorders as well as dissociative, personality and psychosis related disorders. I integrate my training in neuropsychoanalysis, psychoanalytic psychotherapy and my training as a marriage and family therapist to provide evidence based care.
12 Years Experience
Online in Mishawaka, IN

Biopsychosocial
Trauma Recovery Specialist
Licensed Clinical Social Worker, LCSW
You were never meant to carry this pain alone.
If trauma, PTSD, complex PTSD (CPTSD), flashbacks, or nightmares are keeping you stuck in survival mode, you are not weak and you are not broken. Whether you feel trapped by childhood trauma, domestic abuse, anxiety, or painful memories, healing is possible.
You deserve peace. You deserve safety. You deserve to feel whole again.
Together, we can use trauma therapy and EMDR to help you move beyond fear, release the weight of the past, and create the life you have longed for.
📞 Reach out today to begin your trauma recovery journey.
14 Years Experience
Online in Mishawaka, IN

Biopsychosocial
Dr. Vicki D. Coleman (Dr. Vicki), The Coleman Group PLLC & The Anger Doctor
Licensed Professional Counselor, LCPC, LPCC, LPC, LMFT, LCSW, CCMHC, QMHP, MAC, DAC, SAP, CAMF, BCC, HS-BCP
The focus of my practice is to facilitate the client's self-concept and self-esteem. Issues include anger management; addictions; depression; sexual assault/domestic violence; PTSD; career counseling; and multicultural and diverse populations, among others. I am also a State of Nevada Approved Primary and Secondary Supervisor for Marriage & Family Therapy and Clinical Professional Counselor Interns.
36 Years Experience
Online in Mishawaka, IN

Biopsychosocial
Renee Woodall
Psychologist, Ph.D.
I provide therapy for individuals and couples in midlife or retirement—helping you move through life’s changes with clarity, purpose, and hope. You’ve worked hard and cared for others, yet lately something feels off. Whether you’re feeling burned out, overwhelmed by life’s demands, or unsure about what comes next, therapy offers a space to slow down, heal, grow, and begin creating a life that feels more grounded, fulfilling, and enjoyable again.
27 Years Experience
Online in Mishawaka, IN
Biopsychosocial
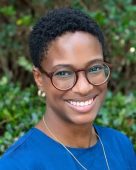
Kourtney Bennett
Psychologist, Ph.D.
Therapy can offer a space to better understand yourself and the experiences that have shaped you. I help adults make sense of trauma, neurodivergence, burnout, identity, and life transitions by understanding their experiences within the context of their relationships, environments, and the systems they have navigated. Together, we'll build practical skills, deepen self-understanding, and create meaningful, lasting change in a compassionate, collaborative space.
9 Years Experience
Online in Mishawaka, IN
Biopsychosocial Therapy therapists in Mishawaka, IN Statistics
Biopsychosocial Therapy therapists in Mishawaka, IN average 17 years of experience and charge around $221 per session. 100% offer online sessions. The most commonly treated issues are Anxiety or Fears (92%), Trauma and PTSD (73%), and Depression (69%).
Average years in practice
17 Years Experience
Average cost per session
$221
Accept insurance
35%
Offer sliding scale
48%
Gender ID
| 80% |
Female |
|
| 20% |
Male |
|
Session Type
| 58% |
In Person and Online |
|
| 42% |
Online Only |
|
Top Specialties
| 92% | Anxiety or Fears |
| 73% | Trauma and PTSD |
| 69% | Depression |
| 63% | Stress |
| 50% | Loss or Grief |
| 48% | ADHD |
| 46% | Self Esteem |
Ages Served
| 98% | Adult |
| 63% | Senior |
| 60% | Young Adult |
| 31% | Teen |
| 25% | Children |
Client Focus
| 52% | Women |
| 38% | Men |
| 33% | LGBTQ+ |
| 29% | Military / Veterans |
| 25% | Persons with Disabilities |