Native American therapists in Sunnyside, WA
Browse Native American therapists in Sunnyside, Washington. Compare credentials, specialties and therapeutic approach. Contact a therapist to learn more.
View nearby cities

Serving Native American
Tiffany Cason
Psychiatric Nurse Practitioner, PMHNP-BC
If you are struggling with ADHD, anxiety, depression, PTSD, bipolar disorder, insomnia, or other mental health challenges, I am here for you. I have more than 6 years of medical experience. I have specialized training in psychiatric mental health, and I have worked in crisis stabilization and outpatient behavioral health settings, supporting individuals with diverse mental health needs.
1 Years Experience
Online in Sunnyside, WA (Online Only)

Serving Native American
Dr. Samira Paul Olive Tree Psychology Clinic LLC
Psychologist, PsyD
At Olive Tree Psychology Clinic LLC, we believe that healing requires entering a space where you feel truly seen, understood, and respected. We honor your presence and we meet you exactly where you are.
7 Years Experience
Online in Sunnyside, WA (Online Only)
Serving Native American
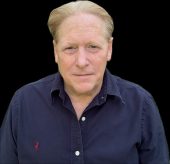
Brian McCormack (Connemara Counseling)
Counselor/Therapist, LPC-A/LMHCA
My counseling philosophy is simple yet profound: to build a genuine therapeutic relationship where you feel understood, supported, and empowered. I am committed to equipping you with the tools and strategies to navigate life’s challenges and create lasting change and renewed purpose."
2 Years Experience
Online in Sunnyside, WA (Online Only)

Serving Native American
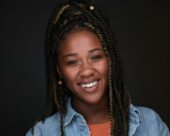
Dr. Char Houben
Psychologist, PhD, LP
Dr. Houben provides therapy that goes beyond merely treating symptoms and takes a depth-oriented perspective in order for us to examine root causes and incorporate enduring change. She views therapy as a collaborative process, focusing on the therapeutic relationship as a vehicle for self-exploration and change. She understands that your cultural background is an integral part of your identity, so she is dedicated to creating a safe, inclusive, and affirming therapeutic space. With a comprehensive approach to treatment, Dr. Houben recognizes that well-being encompasses the integration of mental, emotional, and physical aspects of health and considers the entirety of your being. In therapy, we will begin a collaborative journey together, exploring the depths of your experiences, fostering psychological flexibility, and facilitating profound personal growth. If you are ready to embrace on this transformative process, I am here to understand your lived experiences and provide you the support, guidance, and expertise you need. Together, we will embark on a path toward self-discovery, healing, and, incorporate lasting positive change.
11 Years Experience
Online in Sunnyside, WA
Serving Native American
Stephanie Davis
Hypnotherapist, Cht
Your mind and body are deeply connected—and lasting change begins within. Hypnosis helps reprogram the subconscious mind, easing stress, releasing emotional blocks, and strengthening the mind-body connection. Research shows hypnosis can lower cortisol (the stress hormone) and support overall well-being. Every session is more than relaxation—it's an opportunity to heal, grow, and reconnect with your best self.
4 Years Experience
Online in Sunnyside, WA (Online Only)
Native American therapists in Sunnyside, WA Statistics
Native American therapists in Sunnyside, WA average 14 years of experience and charge around $210 per session. 100% offer online sessions. The most commonly treated issues are Anxiety or Fears (85%), Depression (77%), and Loss or Grief (70%).
Average years in practice
14 Years Experience
Average cost per session
$210
Accept insurance
32%
Offer sliding scale
55%
Gender ID
| 61% |
Female |
|
| 31% |
Male |
|
| 4% |
Gender Fluid |
|
| 4% |
Non-Binary |
|
Session Type
| 68% |
Online Only |
|
| 32% |
In Person and Online |
|
Top Specialties
| 85% | Anxiety or Fears |
| 77% | Depression |
| 70% | Loss or Grief |
| 64% | Trauma and PTSD |
| 62% | Stress |
| 60% | Self Esteem |
| 51% | ADHD |
Ages Served
| 100% | Adult |
| 89% | Young Adult |
| 70% | Senior |
| 45% | Teen |
| 17% | Children |
Client Focus
| 100% | Native American |
| 91% | Women |
| 83% | Hispanic / Latino |
| 81% | LGBTQ+ |
| 79% | Black / African American |