Behavioral therapists in Spanish Fort, AL
Browse Behavioral therapists in Spanish Fort, Alabama. Compare credentials, specialties and therapeutic approach. Contact a therapist to learn more.
Behavioral
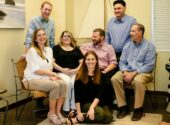
Collins Counseling Associates
Licensed Professional Counselor, LPC, LMFT
For an appointment call (251) 473-3410.
Twelve licensed counselors, with offices in Mobile, Fairhope and Atmore, provide specialized treatment for individuals and families impacted by life problems, relationship stress, mental health issues, substance abuse problems, and abuse. We strive to help people in a safe, private, non-judgmental place to work through issues & ultimately find some peace and happiness in life. Our group includes experts in fields of sex therapy, grief counseling, addiction problems and LGBTQ needs.
21 Years Experience
In-Person Near Spanish Fort, AL
Online in Spanish Fort, AL

Behavioral
Dr. Jeffrey Huttman
Psychologist, Ph.D.
Everybody goes through challenges in life. Some struggles are harder to overcome than others and require the assistance of a highly trained and compassionate therapist. My goal is to provide a comfortable, non-judgmental environment, in which to receive the support and treatment needed to get relief from the symptoms that are bothering you most. I utilize a warm, empathic approach to form a strong therapeutic alliance and work collaboratively with my patients. My style is eclectic; incorporating person centered perspectives with components of Cognitive Behavioral Therapy, Dialectical Behavior Therapy and Mindfulness training.
23 Years Experience
Online in Spanish Fort, AL

Behavioral
Grace in the Shadows
Licensed Professional Counselor, PhD, MDiv, MA, NCMHC, ALMHC, VALMHC, SCMHC, FLMHC, KYMHC, IDMHC
I have been a therapist for over 10 years and running my own company for the last 2. I use a combination of Biblical therapy as well as CBT. I truly care for my clients and desire them to have a more joyful life free of anxiety and depression. I have worked with many individuals, families, and marriages and have seen growth and freedom from stress achieved. I have seen marriages put back together and families and individuals before stronger. I also host a podcast with my wife and we cover topics such as marriage, narcissism, relationships, etc.
11 Years Experience
Online in Spanish Fort, AL (Online Only)
Behavioral
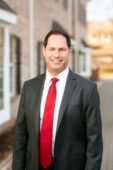
Craig Springer
Psychologist, PhD
*ACCEPTING NEW CLIENTS* Congratulations! By seeking help you have taken a brave step toward achieving your goals and attaining a greater sense of happiness.
20 Years Experience
Online in Spanish Fort, AL
Behavioral
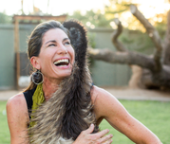
Sumer Statler Aeed
Psychologist, Licensed Psychologist
I am a psychologist that is passionate about all of us living the fully awake and vibrant lives we are meant to. Sometimes this involves healing from the past, other times it means working towards visioning and creating the future, oftentimes both. It generally involves some insight but also a good dose of experiential tools and learning about your central nervous system and how to both understand and work with it, what we call both top down and bottom up tools. Ready for real change and willing to do the work? (yep it is work but well worth it) Let's go.
27 Years Experience
Online in Spanish Fort, AL (Online Only)
Behavioral Therapy therapists in Spanish Fort, AL Statistics
Behavioral Therapy therapists in Spanish Fort, AL average 17 years of experience and charge around $216 per session. 100% offer online sessions. The most commonly treated issues are Anxiety or Fears (93%), Depression (77%), and Stress (65%).
Average years in practice
17 Years Experience
Average cost per session
$216
Accept insurance
43%
Offer sliding scale
36%
Gender ID
| 63% |
Female |
|
| 33% |
Male |
|
| 4% |
Non-Binary |
|
Session Type
| 56% |
In Person and Online |
|
| 44% |
Online Only |
|
Top Specialties
| 93% | Anxiety or Fears |
| 77% | Depression |
| 65% | Stress |
| 62% | Social Anxiety |
| 55% | Self Esteem |
| 52% | ADHD |
| 52% | Trauma and PTSD |
Ages Served
| 94% | Adult |
| 73% | Young Adult |
| 59% | Senior |
| 55% | Teen |
| 28% | Children |
Client Focus
| 49% | Women |
| 37% | Men |
| 29% | LGBTQ+ |
| 29% | Military / Veterans |
| 22% | Persons with Disabilities |