Biopsychosocial therapists in Flowing Wells, AZ
Browse Biopsychosocial therapists in Flowing Wells, Arizona. Compare credentials, specialties and therapeutic approach. Contact a therapist to learn more.
Biopsychosocial
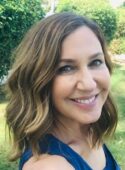
Amy Guido
Licensed Clinical Social Worker, LCSW
Being in relationship with others can uncover areas of strength as well as struggle. If you grew up in a family that didn't do much self reflection, perspective taking, emotion coaching or repair making, you may feel at a bit of a loss with how to navigate relationship struggles in helpful ways.
Perhaps you've vented to friends and family to reduce the tension of the latest disagreement. For most of us though, that doesn't get us the perspective and skills necessary to get unstuck or moving forward more productively. I help people through targeted feedback and support to gain greater relational satisfaction and results. Even if your partner or child won't attend, sometimes the power of one can make a huge difference.
Perhaps today is a good day to take a risk and reach out to see if the change you seek is more attainable than you think. I bring a wholistic, curious, light-hearted, real and down to earth approach that takes into account your unique needs and goals.
If you're ready to try something new and would like support please reach out for help. While I don't accept insurance, I do have current openings. I look forward to hearing from you soon.
22 Years Experience
Online in Flowing Wells, AZ

Biopsychosocial
Lifeline PCS
Counselor/Therapist, Dept of Health Outpatient Treatment Facility License
Lifeline is a team of counselors/therapists with the education and experience to help with most any issue that can bring a person to counseling. We offer a wide variety of programs and approaches that are designed for you. With our large team of providers we are able to find a good fit for you.
20 Years Experience
Online in Flowing Wells, AZ

Biopsychosocial
Emily Rowe
Psychologist, Psy.D.
Are you feeling weighed down by trauma, shame, or family conflict? I specialize in helping individuals navigate the most challenging parts of their lives, from trauma and PTSD to identity struggles and relationship issues. I provide a safe, supportive space where you can explore your emotions without judgment, rebuild your sense of self, and develop tools to move forward with confidence. If you're ready to reclaim your life and start healing, I’m here to guide you every step of the way.
7 Years Experience
Online in Flowing Wells, AZ

Biopsychosocial
Urim Recovery, LLC
Therapist, Certified Trauma Therapist, LCSW
My approach to healing is client-centered through an attachment-based perspective to help clients attain inner calm and a sense of control. I offer supportive counseling with a keen eye for pinpointing your self-defeating patterns, strengths and solutions. What's unique about my approach is my emphasis on in-between session support and activity that empowers individuals to implement what they learn in sessions in practical ways that address their real life stuck points and triggers.
The aim is that you grow in resiliency and confidence to attain welcomed changes in your life. You are wired for healing and connection, and my job is to help you experience this. Key characteristics of my style include being genuine and direct with an emphasis on helping clients find purpose and emotional stability.
12 Years Experience
Online in Flowing Wells, AZ

Biopsychosocial
Christine Sparacino
Psychologist, PsyD
Hi! I'm Dr. Christine Sparacino. I have been working in the mental health field for more than 20 years. I work with highly sensitive and empathic individuals, people navigating loss and life transitions, those feeling with grief and chronic illness and autoimmune disease. Since 2015 I have also worked as a diabetes psychologist, supporting patients with their health.
My main focus is to help individuals navigate difficult seasons and transitions in their lives, such as adjusting to a recent loss or change in health status. My main areas of expertise are: grief and loss, chronic illness and autoimmune disease, and working with Highly Sensitive People and empaths.
23 Years Experience
Online in Flowing Wells, AZ (Online Only)
Biopsychosocial Therapy therapists in Flowing Wells, AZ Statistics
Biopsychosocial Therapy therapists in Flowing Wells, AZ average 17 years of experience and charge around $217 per session. 100% offer online sessions. The most commonly treated issues are Anxiety or Fears (90%), Depression (68%), and Stress (68%).
Average years in practice
17 Years Experience
Average cost per session
$217
Accept insurance
38%
Offer sliding scale
38%
Gender ID
| 77% |
Female |
|
| 23% |
Male |
|
Session Type
| 62% |
In Person and Online |
|
| 38% |
Online Only |
|
Top Specialties
| 90% | Anxiety or Fears |
| 68% | Depression |
| 68% | Stress |
| 64% | Trauma and PTSD |
| 48% | Loss or Grief |
| 48% | Self Esteem |
| 46% | ADHD |
Ages Served
| 98% | Adult |
| 60% | Senior |
| 60% | Young Adult |
| 32% | Teen |
| 22% | Children |
Client Focus
| 56% | Women |
| 36% | Men |
| 32% | LGBTQ+ |
| 26% | Military / Veterans |
| 22% | Persons with Disabilities |