Native American therapists in West Haven, CT
Browse Native American therapists in West Haven, Connecticut. Compare credentials, specialties and therapeutic approach. Contact a therapist to learn more.

Serving Native American
Samantha Allison-Evans, M.A., LPC
Licensed Mental Health Counselor, M.A., LPC
"At Allison Evans Counseling & Consulting, PLLC , our mission is to heal, empower, and transform lives through compassionate counseling services. We strive to empower individuals to reach their full potential and make positive changes in their lives. Our ultimate goal is to help clients achieve personal growth, overcome challenges, and find lasting happiness and fulfillment."
11 Years Experience
Online in West Haven, CT (Online Only)

Serving Native American
Dr. Sophia Aguirre
Psychologist, Ph.D., CGP, F-AGPA
I am a Licensed Psychologist and founder of the Aguirre Center of Inclusive Psychotherapy, a group practiced dedicated to providing culturally-affirming psychotherapy. I have a passion for working with folks who hold marginalized identities including Latinx, BIPOC, LGBTQ+ and relationship-structure minorities.
I have over a decade of experience of providing psychotherapy to individuals, couples, and groups with a wide-range of concerns and struggles, but a common focus in my clinical work is helping individuals establishing healthier, more authentic relationships with themselves and with others.
17 Years Experience
Online in West Haven, CT
Serving Native American
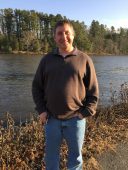
Clear Path Counseling and Wellness Center
Licensed Professional Counselor, MA. LPC
Life can feel overwhelming when anxiety, trauma, stress, relationship problems, or difficult life transitions begin affecting your emotional well-being and daily life. Therapy provides a safe and supportive space to better understand yourself, heal from past experiences, reduce emotional distress, and create a more meaningful, balanced, and fulfilling life. Many people seek counseling for anxiety, depression, trauma, PTSD, overwhelming emotions, relationship or family issues, grief, burnout, low self-esteem, or simply feeling stuck and disconnected from themselves.
Brad provides trauma-informed counseling and EMDR therapy to help clients identify and resolve the deeper issues contributing to emotional pain, unhealthy patterns, and ongoing stress. Together, you will explore current struggles and past experiences to better understand what may be keeping you feeling overwhelmed, unhappy, or unable to move forward. The goal of therapy is not only symptom relief, but meaningful and lasting healing that helps you regain clarity, confidence, peace, and emotional balance.
Brad takes a holistic and personalized approach to therapy, recognizing that every person’s experiences, needs, and healing process are unique. His counseling style is warm, compassionate, interactive, and non-judgmental, helping clients feel genuinely supported, understood, and empowered throughout the therapeutic process.
Using EMDR therapy (Eye Movement Desensitization and Reprocessing), trauma-focused counseling, and holistic therapeutic approaches, Brad helps clients process unresolved trauma, strengthen emotional resilience, increase self-awareness, and develop healthier ways of coping and relating. Therapy focuses on helping clients break unhealthy patterns, reconnect with their inner strengths, and move beyond the pain of the past so they can live with greater purpose, freedom, and fulfillment.
Healing and positive change are possible. No issue is too small or too overwhelming to address in therapy. With the right support, you can reduce stress, restore hope, build resilience, and create the life and relationships you truly want.
Virtual counseling and online EMDR therapy sessions are available, providing private and convenient access to professional trauma-focused therapy from the comfort of your home.
28 Years Experience
Online in West Haven, CT (Online Only)

Serving Native American
Total Wellness Center
Treatment Center, We have LCSWs and LPCs providing various talk therapies. It's key to find a provider who fits your unique needs.
At Total Wellness Center, we understand that seeking help is a big step. Our compassionate team is dedicated to supporting you on your journey to better mental health. We’re ready to listen and provide personalized care to help you live a healthier, more fulfilling life. Contact us today to schedule your appointment and start your path to wellness!
11 Years Experience
Online in West Haven, CT
Serving Native American
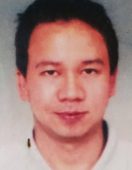
Julien Moe
Hypnotherapist, Diploma in Clinical and Applied Hypnosis, Diploma in Life Coaching
"Welcome to Moe Psychological Services with A Touch Of Care. Time to shine & be a new YOU! Moe Psychological Services has been helping clients enhancing & enriching their lives. Whether your issues are psychological, family, academic, social, dating, or professional, we can help you help yourself get resilient in no time. Affordable and efficient life coaching and clinical hypnotherapy available on Skype, phone, text, FaceTime and homebound. We use DIcit hypnotherapy, and other clinical hynotherapies. What matters most is the soonest recovery of our clients."
10 Years Experience
Online in West Haven, CT
Native American therapists in West Haven, CT Statistics
Native American therapists in West Haven, CT average 17 years of experience and charge around $239 per session. 100% offer online sessions. The most commonly treated issues are Anxiety or Fears (88%), Depression (79%), and Loss or Grief (70%).
Average years in practice
17 Years Experience
Average cost per session
$239
Accept insurance
35%
Offer sliding scale
40%
Gender ID
| 67% |
Female |
|
| 29% |
Male |
|
| 2% |
Gender Fluid |
|
| 2% |
Non-Binary |
|
Session Type
| 56% |
Online Only |
|
| 44% |
In Person and Online |
|
Top Specialties
| 88% | Anxiety or Fears |
| 79% | Depression |
| 70% | Loss or Grief |
| 67% | Trauma and PTSD |
| 60% | Self Esteem |
| 51% | Divorce |
| 51% | Stress |
Ages Served
| 100% | Adult |
| 91% | Young Adult |
| 74% | Senior |
| 35% | Teen |
| 16% | Children |
Client Focus
| 100% | Native American |
| 95% | Women |
| 91% | Hispanic / Latino |
| 84% | Black / African American |
| 79% | Asian |