Hispanic / Latino therapists in Florence, OR
Browse Hispanic / Latino therapists in Florence, Oregon. Compare credentials, specialties and therapeutic approach. Contact a therapist to learn more.
Serving Hispanic / Latino
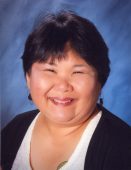
Malama Counseling, LLC
Licensed Professional Counselor, MA, LPC
I am certified Eating Disorders therapist. I have worked as a mental health therapist for 10 years, working with a wide variety of people including those with severe and persistent mental health challenges.
10 Years Experience
Online in Florence, OR

Serving Hispanic / Latino
Well Coast Medical
Psychiatrist, LMFT, LCSW, LPCC, MD, PMHNP
Our diverse team of experienced therapists customize treatment for the unique needs of each individual or couple. We specialize in treatment of anxiety, depression, bipolar disorder, trauma, OCD and ADHD for children, adolescents and adults. We want to make sure you feel comfortable and get the help you need in the way in the way that works best for you. You'll find our therapists to be warm, engaging, compassionate and affirming. Our goal is to empower YOU to have the tools and strength to live your best life.
17 Years Experience
Online in Florence, OR (Online Only)
Serving Hispanic / Latino
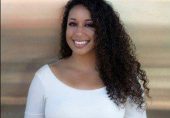
Amber McKinney-Morgan
Licensed Clinical Social Worker, LCSW, LICSW
Amber provides therapy with a holistic and eclectic approach that is individualized, taking into account that the client is the expert of what they need and how they best retain information. The therapeutic process can incorporate interventions related, but not limited to, Eye Movement desensitization and Reprocessing (EMDR), internal family systems (IFS), Somatic Experiencing (SE), Sex Therapy, Hypnosis, CBT-E, EFT, Bowen, Gottman and more.
8 Years Experience
Online in Florence, OR (Online Only)

Serving Hispanic / Latino
Linda Schartman, MA LPC
Counselor/Therapist, Licensed Professional Counselor
I have 14+ years of experience working in diverse mental health capacities. I earned a masters degree in sociology that informs my focus on context; as well as a masters in clinical mental health counseling that guided me in helping individuals most effectively. Currently, I specialize in supporting individuals navigating gender expression, sexual orientation, neurodiversity, disabilities, and minority stress. I offer a non-judgmental, compassionate space where you can feel understood, heal, and make meaningful changes. Together, we’ll work toward your personal goals, cultivating a life that aligns with your values and true self.
6 Years Experience
Online in Florence, OR (Online Only)

Serving Hispanic / Latino
Ben Mosebach
Licensed Professional Counselor, LPC
Hey there, I'm Ben Mosebach and I'm not your typical therapist. I'm not here to offer you clichés or empty promises. What I offer is authenticity and the potential to profoundly impact your life. My approach to therapy is straightforward and down-to-earth. Theoretically I am rooted in the humanistic perspectives encompassing aspects of existentialism, gestalt and person centered therapy. But I'm not interested in wasting your time with superficial chatter or jargon-filled language. I'm here to roll up my sleeves and get to work with you, tackling whatever challenges you're facing head-on.
7 Years Experience
Online in Florence, OR
Hispanic / Latino therapists in Florence, OR Statistics
Hispanic / Latino therapists in Florence, OR average 16 years of experience and charge around $229 per session. 100% offer online sessions. The most commonly treated issues are Anxiety or Fears (68%), Loss or Grief (68%), and Depression (62%).
Average years in practice
16 Years Experience
Average cost per session
$229
Accept insurance
41%
Offer sliding scale
56%
Gender ID
| 61% |
Female |
|
| 28% |
Male |
|
| 8% |
Non-Binary |
|
| 3% |
Gender Fluid |
|
Session Type
| 50% |
In Person and Online |
|
| 50% |
Online Only |
|
Top Specialties
| 68% | Anxiety or Fears |
| 68% | Loss or Grief |
| 62% | Depression |
| 59% | Self Esteem |
| 56% | Stress |
| 53% | Life Coaching |
| 53% | Trauma and PTSD |
Ages Served
| 100% | Adult |
| 74% | Senior |
| 71% | Young Adult |
| 38% | Teen |
| 24% | Children |
Client Focus
| 100% | Hispanic / Latino |
| 88% | Women |
| 82% | LGBTQ+ |
| 82% | Men |
| 76% | Christian |